Down, Down, Down: Energy Prices in the 2010s
By Evelyn Teel
A previous blog post highlighted the shale gas revolution as arguably the most significant energy-related development of the previous decade (you can find the post here: https://avalonenergy.us/2019/12/shale-we-review-the-2010s/). In this article, we will discuss another trend that was significant in the 2010s – declining energy prices.
Natural Gas Prices
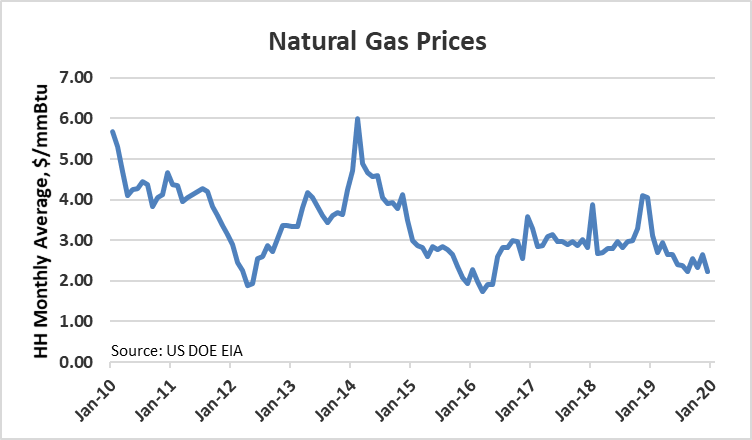
One major effect of the shale gas revolution has been that energy prices in the United States have dropped. In particular, natural gas prices have dropped precipitously as new supply has come online. Prices are significantly lower than they were in 2010 generally, and nearing a third of what they were in January 2010 specifically. Please see the graph below, which shows monthly average natural gas prices at the Henry Hub.
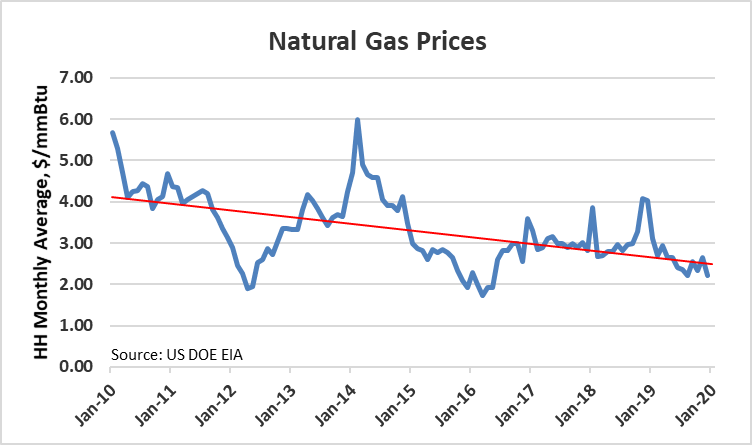
Superimposing a best-fit linear trend line (in red on the graph below) shows just how dramatic the decade-long decline in prices has been. A few peaks and valleys along the way can obscure the overall change, but the trend line shows that prices are approaching half of what they were in 2010.
The Forward Curve
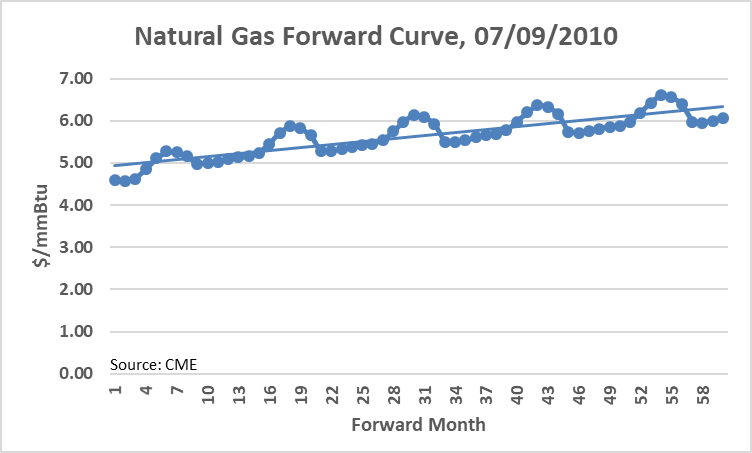
The above graphs illustrate that natural gas prices are significantly lower today than they were a decade ago. Equally notable is the change in the forward curve over the past decade. The forward curve represents the market’s expectation of natural gas prices from one month to five years, and even longer, into the future. Below is the 60-month forward curve as of July 9, 2010. The trend was upward sloping, meaning that the market expected prices to continue to rise, with prices ranging from $4.58/mmBtu up to $6.61 per mmBtu.
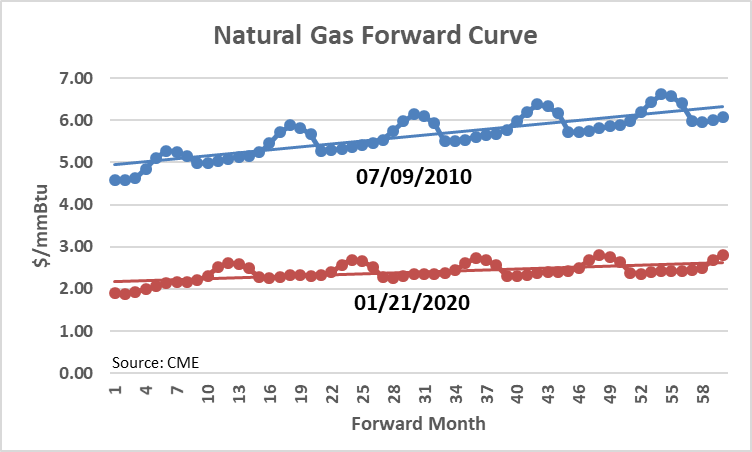
In the graph below, the natural gas forward curve as of January 21, 2020 has been added. The trend line of this 60-month forward curve is very nearly flat. This means the market expects prices to stay fairly level with prices fluctuating very modestly, between $1.89 per mmBtu and $2.81 per mmBtu.
Electricity Prices
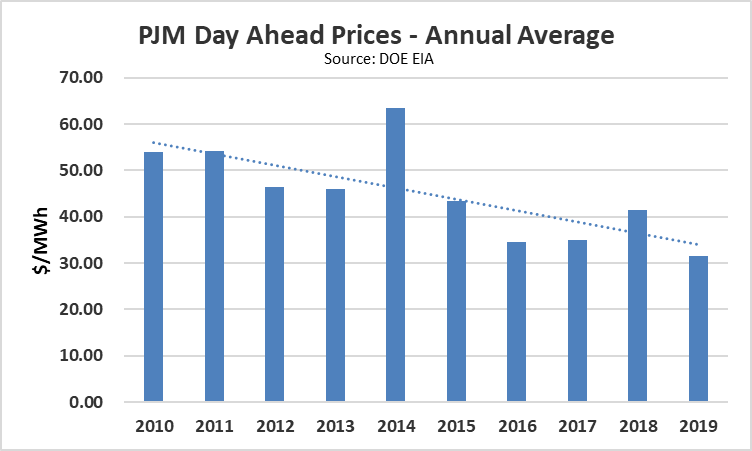
Though less significantly than natural gas prices, electricity prices have likewise fallen. The graph below shows average annual day-ahead electricity prices in PJM. Though there were a few price jumps along the way, the trend over the past decade was that prices declined. Compared to prices in 2010, prices in 2019 were down approximately $20 per MWh.
Historically, natural gas has often been the marginal generation source called upon to produce electricity, meaning that natural gas generation often sets the price for electricity. While the relationship between natural gas and electricity prices changes over time, the correlation has generally been strong. Also note, that though electricity prices in the wholesale market have fallen, utility distribution charges have been on the rise, and this has generally offset reductions in the cost of electricity generation on customers’ bills. For more information on the evolving relationship between natural gas and electricity prices, please see several of our previous blog posts:
Natural Gas and Electricity Are Parting Ways – Part 1
Natural Gas and Electricity Are Parting Ways – Part 2
Conclusion
With shale gas production projected to increase for the foreseeable future; the US expected to continue expanding as an exporter of liquified natural gas (LNG); greater emphasis on economic discipline (profitability over singular focus on reserve additions) by E&P companies; and the electricity fuel mix continuing to change based on both economics and technical advances that allow increasing renewables into the mix, it will be interesting to see how energy prices respond in the coming decade.
Interested in locking in today’s low energy prices? Please call or email us to discuss your options.
The Avalon Advantage – Visit our website at www.avalonenergy.us, call us at 888-484-8096, or email us at info@avalonenergy.us.
Please feel free to share this article. If you do, please email or post the web link. Unauthorized copying, retransmission, or republication is prohibited.
All images copyright 2020 Avalon Energy® Services LLC
Copyright 2020 by Avalon Energy® Services LLC