Separate Paths – Part 2
By Ana Rasmussen, Intern
Our last blog post Separate Paths – Part 1looked at how electricity distribution costs have been rising since 2008 and many of our readers have had questions about just why this is happening. In order to explore this, and to try to get some answers, I dove in and analyzed seven years’ worth of Pepco electric bills from a representative home in Pepco’s Maryland service territory. Before sharing my findings, I want to acknowledge that my base data is just from one household, which can be problematic for making generalizations. However, the kWh rates for individual charges should be representative and similar for other residences in the area over these years. I cannot account for differences in usage from one household to the next, but I believe this can shed some light on the larger shifts taking place within the utility cost structure.
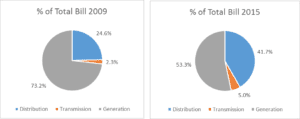
First, once all of the data was collected and organized I looked at the percentages of the total bills that were from electricity distribution, transmission and generation. As you can see in the charts below, a drastic transformation has taken place. In 2009 distribution charges accounted for 24.6% of the total bill, but by 2015 it makes up 41.7% of it. The portion of the bill coming from transmission charges also more than doubles during this period resulting in generation’s share to fall to just over 50% of the total bill. While generation’s portion of the bill has been falling, transmission and distribution have been on the rise since 2009.
Next, I decided to focus on distribution and breakdown the individual rates and charges included under distribution on the Pepco bills. The four most important components of the distribution charge, and the way in which they are charged, are as follows:

Please note Pepco’s distribution energy charges are different from their generation energy charges. Generation energy charges represent the cost of procuring energy for customers. Distribution energy charges represent the cost of providing electricity delivery services to customers. These distribution energy charges are billed on a kilowatt-hour usage basis. So, while they are referred to as “energy charges,” they do not relate to the procurement of energy, only to the delivery of energy.
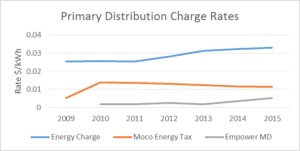
The customer charge is a flat rate charged once a month. Over this period, the charge has gradually risen from $6.65 to $7.39 a month. In the chart below you can see the yearly average rate for the other three primary components of distribution. Although the Montgomery Country Energy Tax has fallen slightly since 2009, both distribution energy charge and Empower MD charge have risen.
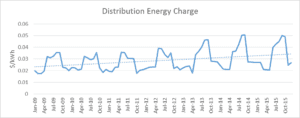
Throughout this time period the average yearly distribution energy charge has been increasing, but to get a better understanding of it on a unit rates basis, I charted them by month. Below you can see how the rate falls in the winter months and rises during the summer months. Over the seven year period, the distribution energy charge has increased, on average, about 6.8% per year. Also notable is the growing distance from peak to trough each year.
After an in depth look at seven years’ worth of residential Pepco electric utility bills, the shifts in generation, transmission and especially distribution have become more clear. Although far from perfect due to a lack of access a broader set of data, I hope that this analysis has been able to provide some insight on current trends and answer some of your questions.
The Avalon Advantage– Visit our website atwww.AvalonEnergy.US, call us at 888-484-8096, or email us atjmcdonnell@avalonenergy.us. Please feel free to share this article. If you do, please email or post the web link. Unauthorized copying, retransmission, or republication is prohibited. Copyright 2016 by Avalon Energy®Services LLC.