Shale We Review the 2010s?
By Evelyn Teel and Jim McDonnell
With the decade coming to a close, this is a perfect opportunity to look back at how the energy market has changed over the past ten years. It has certainly been a whirlwind ride, starting shortly after the 2008 stock market crash and continuing through the Great Recession and the subsequent recovery. The decade also saw the shale gas revolution take hold. Arguably the most significant change in the energy market over the past ten years, the shale gas revolution has not only provided great economic benefit within the United States but also reshaped our position on the world stage.
The two technologies instrumental to the shale gas revolution – hydraulic fracturing (i.e., fracking, or inducing porosity and permeability in rock) and directional drilling (greatly increasing a wellbore’s exposure to hydrocarbon bearing formations) – have been around for decades. However, Texan George P. Mitchell of Mitchell Energy & Development Corp., through sheer determination and personal will over seventeen years, was able to advance and combine these technologies, thus enabling the extraction of natural gas from shale formations that are of low porosity (i.e., not much pore space in the rock) and low permeability (i.e., the pore spaces are not well interconnected). These formations underlie large swaths of the United States, and the proven reserves of natural gas have consistently increased over the past decade.
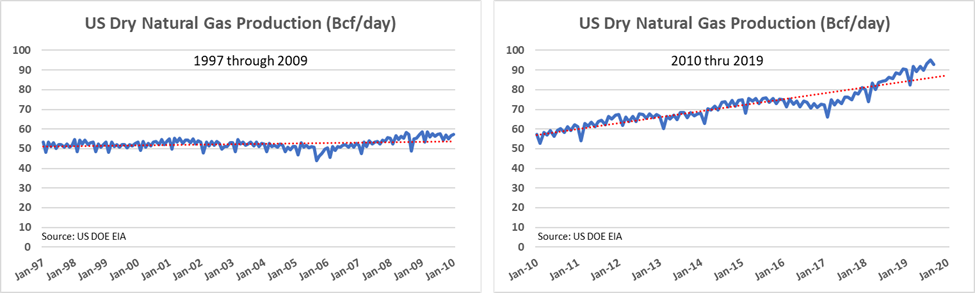
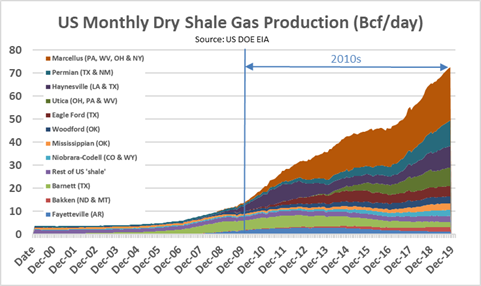
The shale gas revolution is commonly considered to have started in 2008, and in the 2010s, we have witnessed the remarkable changes that have resulted from its growth. As fracked wells have come online, the ready supply of low-cost natural gas has transformed the energy industry in America and the world. The graph below on the left shows the volume of natural gas produced daily in the United States between 1997 and 2010, measured in billions of cubic feet per day (Bcf/day). Production over this period remained relatively flat, averaging about 50 Bcf/day. Compare that to the graph on the right, which shows the volume of natural gas produced in the United States from 2010 to the present. The volume of natural gas produced daily has very nearly doubled to about 93 Bcf/day.
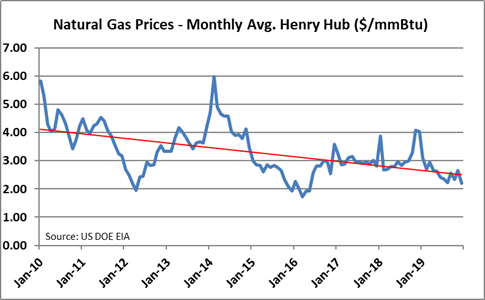
Though demand for natural gas has increased, the more dramatically increasing supply of natural gas has driven down its price. The graph below shows how US natural gas prices at the Henry Hub have declined from about $6 per million Btu (mmBtu) to $2.19 per mmBtu today.
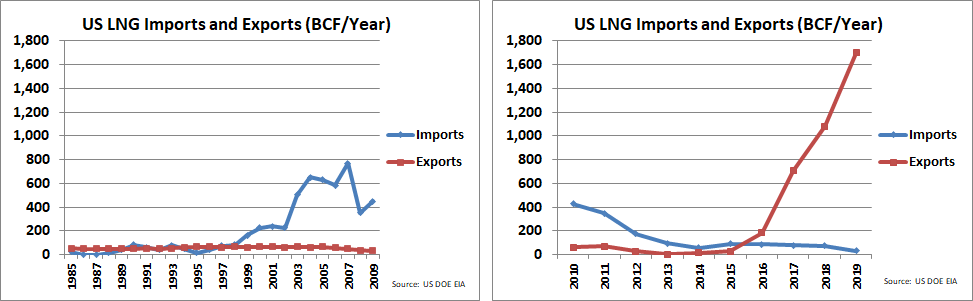
Due to the increased availability of cheap, abundant natural gas, an increasing number of liquified natural gas (LNG) export terminals have come online, and the United States has become a major exporter of LNG. This reverses a long-term trend of rising LNG imports. The graphs below show US LNG imports and exports from 1985 – 2009 (left) and 2010 – 2019 (right).
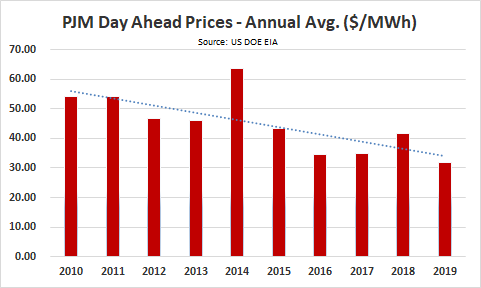
In most parts of the country, natural gas prices and electricity prices are strongly correlated. As natural gas prices move so do, generally, electricity prices. Thus, as natural gas prices have fallen, electricity prices have fallen as well. The graph below shows wholesale electricity prices in the Mid-Atlantic measured in dollars per megawatt-hour ($/MWH). Wholesale electricity prices are almost half of what they were ten years ago.
The abundance of natural gas and the declining prices of natural gas and electricity have been driven by the dramatic increase in shale gas production.
The map and graph below identify the regions and geological “plays” in the US where shale gas production is occurring. Shale gas production has increased to two-thirds of this rising total US natural gas production from only a minor contribution only ten years ago.

Though many people doubted fracking would work with crude oil deposits, as oil molecules are much larger than those of natural gas, Mark Papa of EOG Resources, Harold Hamm of Continental Resources, and others have been able to adapt fracking technology to the extraction of oil. We have thus seen a shale oil revolution take hold, which has brought benefits similar to those of the shale gas revolution. It has driven down petroleum prices in the United States and dramatically reduced our dependence on foreign oil. The US recently became a net exporter of oil products (refined petroleum and crude oil). Overall, the US is now the world’s largest producer of natural gas (93 Bcf per day versus 58 Bcf per day during 2010) and crude oil (13 million barrels per day versus 5.5 million barrels per day during 2010).
The shale revolutions have significantly changed the US energy landscape over the past decade. They have brought online abundant sources of low-cost domestic energy, which have driven down consumer prices, boosted our economy, created jobs, improved America’s energy security, and increased revenue to state and local governments and the federal government. Fracking and directional drilling require a smaller footprint than traditional drilling, and have helped reduce CO2 emissions as natural gas is being substituted for coal in electricity generation. Low cost, abundant natural gas complements intermittent sources of energy such as wind and solar.
In addition to all the benefits noted above, low energy prices in the United States have expanded the manufacturing sector and made the country more attractive to companies willing to relocate from overseas. Indeed, the shale revolutions have done nothing less than improve the United States’ geopolitical position, reducing our dependence on foreign oil and shoring up our export capacity.
Like any fuel source, shale gas comes with trade-offs. There are concerns about induced seismicity, water and air pollution, and health impacts. Further technological advances and refinements in the field may alleviate these concerns, and we look forward to seeing how this industry progresses in the 2020s.
The Avalon Advantage – Visit our website at www.avalonenergy.us, call us at 888-484-8096, or email us at info@avalonenergy.us.
Please feel free to share this article. If you do, please email or post the web link. Unauthorized copying, retransmission, or republication is prohibited.
All images copyright 2019 Avalon Energy® Services LLC
Copyright 2019 by Avalon Energy® Services LLC