Archive for May 2022
Market Update
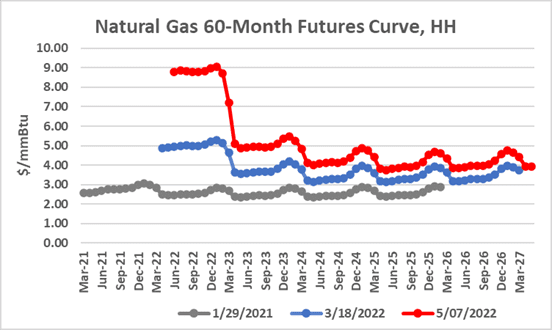
Market Update We looked at natural gas prices during mid-March compared to prices during the pandemic. The graph below plots forward natural gas prices at two points in time. The grey line represents the forward curve as of January 29, 2021 and the blue line as of March 18, 2022. It is important to note…
Read More