What a Difference a Year Makes
What a Difference a Year Makes
Last September, our COO, Jim McDonnell, was the lead-off speaker for the first session of the Maryland Clean Energy Center’s Energy Economy Speaker Series. The topic was State of the Sector: Impacts of Covid-19 on the Energy Economy. Jim provided a broad energy market update and then focused on the differential impact of the pandemic on energy usage in various industry sectors. The presentation can be found at the following link, at 5:34 into the talk.
In the News: Jim McDonnell Talks Energy Markets and Covid-19
How has the energy market, specifically the natural gas market, changed since then? What a difference a year makes.
In January 2021, the natural gas forward curve was still bouncing along near all-time lows, especially when adjusted for inflation. The graph below shows the forward curve as of January 29, 2021.
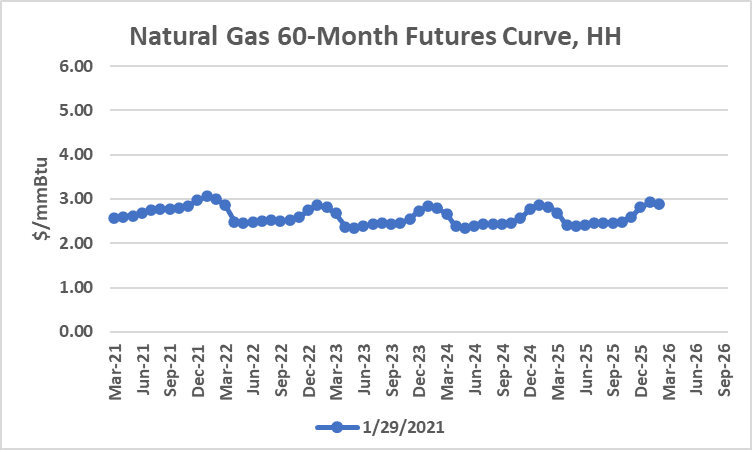
Since then, natural gas prices have risen dramatically, as shown by the red line on the graph below. More specifically, the curve has become significantly backwardated, meaning the months close in time are priced significantly above months further into the future.
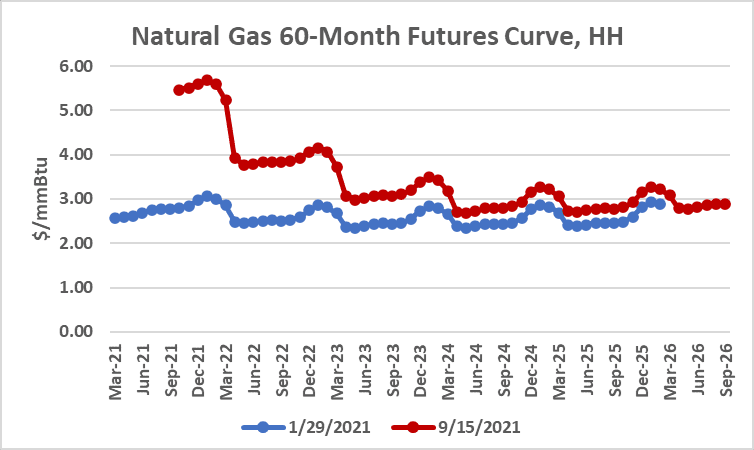
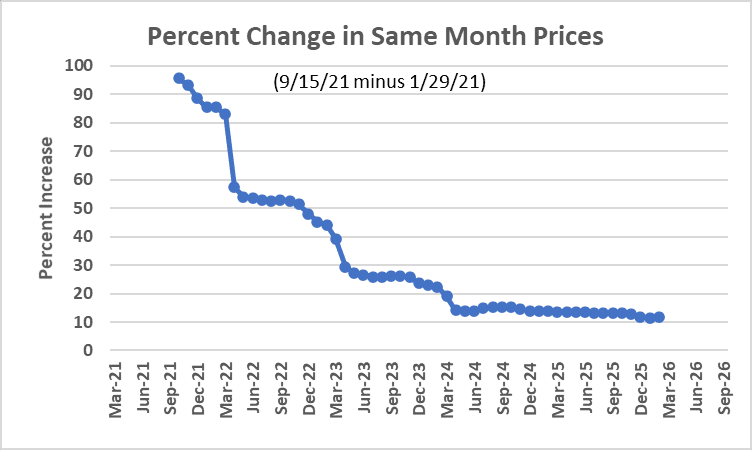
Near month prices for the remaining months in 2021, have nearly doubled. The 2022 calendar strip is up 61%, while the 2023 and 2024 strips are up “only” 30% and 16% respectively. Individual monthly changes are shown on the graph below.
Factors influencing this forward curve include the following:
- Natural gas production is currently about 90 Bcf/day, still well below pre-pandemic highs of 97 Bcf/d.
- With newfound fiscal discipline, producers are focusing on paying down debt and keeping cash flow positive. Despite the higher price environment, this means less capital is available for drilling.
- The drilled but uncompleted (DUCs) well inventory continues to decline as producers focus on these lower cost well completions. The EIA recently reported that as of July, there were 5,957 DUCs, the lowest for any month since November 2017. See https://www.eia.gov/todayinenergy/detail.php?id=49456&src=email
- The current natural gas storage level of 2.9 Bcf is at an 8% deficit compared to the 5-year average for this time of year. This means potentially lower supply during the upcoming winter.
- Offshore Gulf Coast natural gas production and onshore processing facilities remain disrupted due to the lingering effects of Hurricanes Ida and Nicholas.
- Above-average temperatures across much of the US (it was the 6th hottest summer since 1950) led to higher-than-average power burn this summer, which is expected to continue into the fall.
- The coal fleet has largely reached capacity, further driving up natural gas power burn.
- With exceptionally high natural gas prices in Asia ($21/mmBtu) and Europe ($18/mmBtu), US LNG exports remain strong at about 11.5 Bcf per day, with new export terminal capacity coming online next year.
- Exports to Mexico remain strong at about 6.3 Bcf/day.
How can energy users manage in this environment?
- Despite the run-up in prices in the months closer in time, there is still value in the 2023 through 2026 timeframe.
- Prices in that timeframe are not far from the 10-year average price of about $3.
- By contracting further into the future, weighted average prices can be brought down.
Evelyn Teel contributed to this article.
The Avalon Advantage – Visit our website at www.avalonenergy.us, call us at 888-484-8096, or email us at info@avalonenergy.us.
Please feel free to share this article. If you do, please email or post the web link. Unauthorized copying, retransmission, or republication is prohibited.
Copyright 2021 by Avalon Energy® Services LLC