Welcome Back to 1976
By Evelyn Teel and Jim McDonnell
Our last blog post discussed the trend of decreasing natural gas prices in the 2010s (please find that blog post at this link: https://avalonenergy.us/2020/01/down-down-down-energy-prices-in-the-2010s/). What does the trend in natural gas prices look like if we go further back in time? To answer this question, we extended our look-back to 44 years.
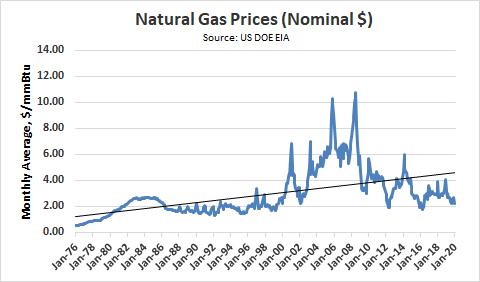
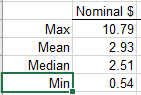
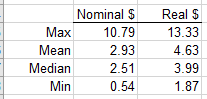
The graph below shows natural gas prices (monthly average) over the 528 months spanning January 1976 through December 2019. Prices have fluctuated significantly, with particularly big run-ups during the early 2000s. Natural gas prices have been as low as $0.54/mmBtu and as high as $10.79. Overall, prices have trended upwards. These prices are in “nominal” dollars, meaning dollars of the day, and are not adjusted for inflation.
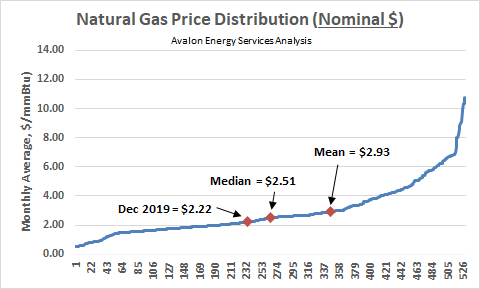
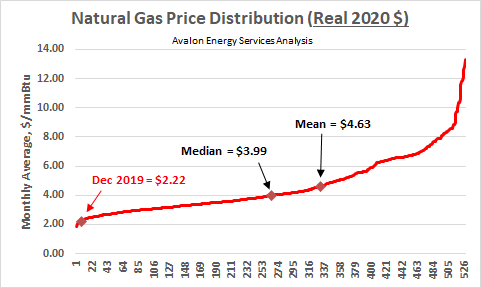
If we sort the 528 months of price data from lowest to highest, we can see that today’s prices are significantly below both the median and average prices of the full dataset. This means that for the majority of the past 4+ decades, natural gas prices have been higher than they are today.
As indicated, the two graphs above show prices in nominal dollars. When we adjust for inflation, the story changes rather dramatically. The following two graphs show the pricing data in “real” dollars, specifically adjusted into today’s dollars.
Adjusted for inflation, over the 528 months, the low price was $1.87/mmBtu and the high was $13.33/mmBtu. Overall, inflation adjusted prices have trended sideways.
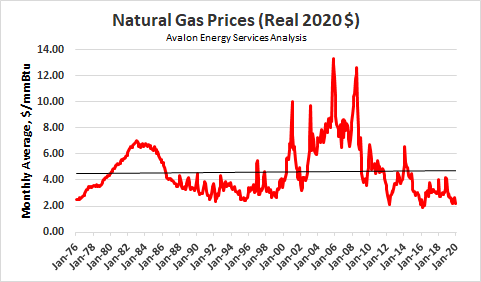
Looking at the December 2019 monthly average of $2.22/mmBtu, it is very nearly the lowest natural gas price since 1976, adjusted for inflation. More specifically, it was the 8th lowest of all 528 months under review.
The graph below shows nominal and real natural gas prices plotted together. Viewing the data this way highlights the effects of inflation.
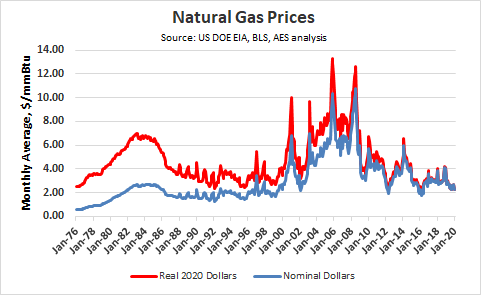
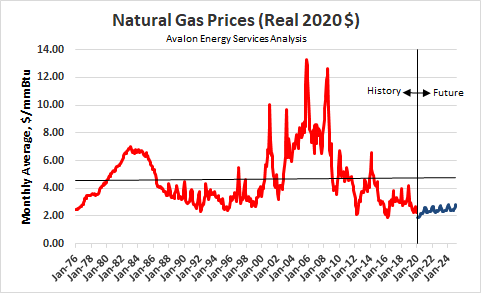
It is remarkable to note that, in real dollars, natural gas prices are basically the same as they were 44 years ago – and they are significantly lower today than they have been for most of that period. Plus, not only are prices low today, they are expected to remain low for the foreseeable future. Appending the natural gas forward curve (which represents the market’s view of pricing five years, and even further, into the future) to the historical real dollar price graph shows that prices are expected to remain flat.
So, when a friend refers to 1976 as a wonderful time of low natural gas prices, trading at around $0.54/mmBtu, tell them, adjusted for inflation, that is $2.50/mmBtu in today’s dollars. With current prices as of this writing now below $2.00/mmBtu, for natural gas buyers, as Carly Simon sings, “…these are the good old days.” For natural gas producers, not so much.
The natural gas market has seen some remarkable changes since 1976, driven by technological advances, economic fluctuations, and global political considerations. It is also increasingly sharing the electricity-generation space with a range of competitors, particularly a rapidly-expanding volume of renewables such as wind and solar. It is an exciting time, as the US is generating increasingly clean electricity and building a more sustainable energy system. We can be relatively certain that the energy market in 2064 won’t much resemble the one today, and it will be fascinating to see which factors most drive change in the future.
Interested in learning how you can benefit from today’s low energy prices? Call or email us today and we’d be happy to help you explore your options.
The Avalon Advantage – Visit our website at www.avalonenergy.us, call us at 888-484-8096, or email us at info@avalonenergy.us.
Please feel free to share this article. If you do, please email or post the web link. Unauthorized copying, retransmission, or republication is prohibited.
All images copyright 2020 Avalon Energy® Services LLC
Copyright 2020 by Avalon Energy® Services LLC