Real Electricity Prices (Energy Prices Always Go Up, Part 5)
An article published recently by CNSNews.com states that, according to the Bureau of Labor Statistics (BLS), “The price of electricity hit a record for the month of October” and that “Americans now pay 42 percent more for electricity than they did a decade ago.” Sounds scary.
Is it? Let’s see.
Here, in graphical form, are the October US City Average electricity prices, in dollars per kilowatt-hour (kWh), as found on the BLS website.
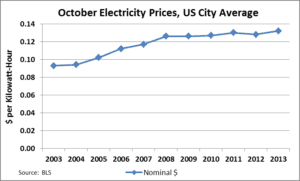
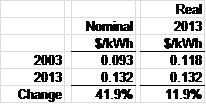
During the period of time from 2003 to 2013, October electricity prices rose from $0.093/kWh to $0.132/kWh, a 41.9% increase.
It is important to note that the data above are in “nominal” dollars and do not account for the effects of inflation. Over the time period examined, the purchasing power of a dollar has declined, so the electricity prices presented above are not being compared on a consistent basis. In order to make the data consistent, we can normalize it by adjusting for inflation by converting the data to “real” 2013 dollars. Another BLS dataset can help with this.
The BLS tracks changes in the purchasing power of a dollar through its Consumer Price Index (CPI). The CPI can be used to convert dollar values from past years into inflation-adjusted dollar values for the current year. For example, the 2003 electricity prices can be converted to 2013 dollars as follows:
Electricity Price 2013 = Electricity Price 2003 x (CPI Base Year / CPI Current Year)
Electricity Price 2013 = $0.093/kWh x (232.9/184.0)
Electricity Price 2013 = $0.118/kWh
The graph below shows the nominal electricity prices presented above along with the same data converted to real 2013 dollars:
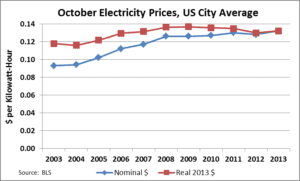
The 42% increase on a nominal basis equates to only a 12% increase in real dollars. Not quite so scary.
Looking further back in time, how have electricity prices behaved in nominal and real terms?
The graph below shows October electricity prices from the same BLS dataset for the period of time 1979 to 2013.
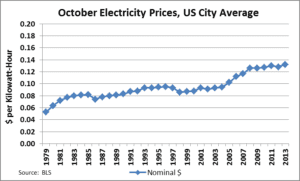
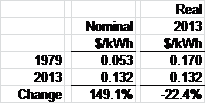
Over this period, October electricity prices have increased from $0.053/kWh to $0.132/kWh, a 149.1% increase.
The graph below shows the same data converted to real 2013 dollars:
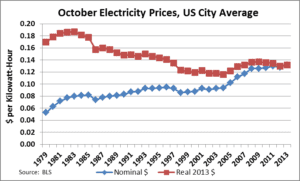
In real 2013 dollars, October electricity prices have DECLINED from $0.170/kWh to $0.132/kWh. This is a 22.4% decline in real dollars.
Do electricity prices always go up? In real terms, no.
The Avalon Advantage – Visit our website at www.avalonenergy.us, call us at 888-484-8096, or email us at jmcdonnell@avalonenergy.us.
Please feel free to share this article. If you do, please email or post the web link. Unauthorized copying, retransmission, or republication is prohibited.
Copyright 2013 by Avalon Energy® Services LLC

1. U. S. average electricity prices are down in real terms largely because of low natural gas prices which also help hold down coal prices.
2. Also, note that U.S. average elecricity prices do not include tax breaks and subsidies that flow directly to generation unit owners, particularly federal PTC, accelerated depreciation, and perhaps 1603 Treasury grants, and state tax breaks and subsidies.
3. It would be interesting to see what prices would have been in states with RPS while also taking into accout the benefits of tax breaks and subsidies to genration unit owners.
4. Further, it would be interesting to see a comparison of price changes in states within and without RPS.