Crude Oil and Natural Gas Move to Different Hemispheres
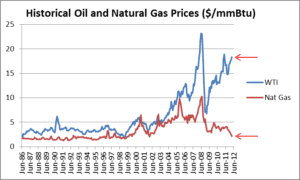
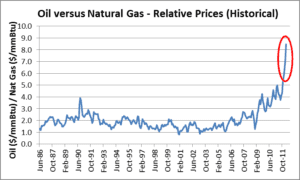
On December 16, 2011, we looked at the relationship between natural gas and crude oil prices (see “Crude Oil and Natural Gas Get a Divorce” here). We looked at how historically, on an energy equivalent basis ($/mmBtu), crude oil (West Texas Intermediate at Cushing, Oklahoma) traded at about a 50% premium to natural gas at the Henry Hub in Louisiana, reflecting crude oil’s greater energy density, portability, and flexibility. We also looked at how, more recently, natural gas and crude oil prices had become decoupled and how the ratio of the price of crude oil to the price of natural gas had moved from the 1.5x historical multiple to, in December 2011, the astoundinglevel of 4.9x.
What is the relationship now?
From December 2011 to the end of March 2012, crude oil prices continued to rise, from $99.41/Bbl to $106.16/Bbl, while natural gas pricescontinued to decline, from $2.99/mmBtu to $2.17/mmBtu. The primary drivers of these price changes have been the Iranian oil embargo (crude oil) and the US overhang of natural gas in storage. The graph below shows monthly average crude oil and natural gas prices on an energy equivalent basis through March.
This continued divergence in price movement drove the energy equivalent crude oil/natural gas price ratio from 4.9x to8.5x at the end of March, as shown on the graph below.
Where does the relationship appear to be headed in the future?
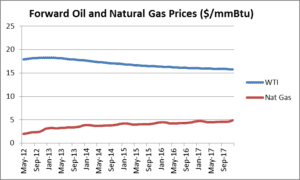
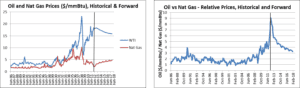
As of April 13, 2012, the forward market expects the price of crude oil to rise over the next nine months, from $17.93/mmBtu ($103.64.Bbl) in May 2012 to $18.28/mmBtu ($105.64/Bbl) by January 2013, and then to decline. At the same time, the market expects natural gas prices to rise from $1.98/mmBtu in May 2012 to $3.23/mmBtu over the same time period. Expectations are that crude oil will fall to $15.81/mmBtu ($91.41/Bbl) by December 2017 while natural gas will continue to rise but remain under $5.00/mmBtu over that 68 month period. These data are presented in table and graph format below:

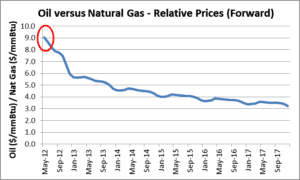
The May contract prices for WTI crude oil and natural gas at $17.93/mmBtu ($103.64/Bbl) and $1.98/mmBtu, respectively, mean that crude oil is trading at NINE TIMES the price of natural gas on an energy equivalent basis. From a historical multiple of 1.5x to 9.0x now, crude oil and natural gas not only got a divorce, they moved to different hemispheres. Expectations are that this ratio will decline, but only to 3.2x by December 2017.
The graphs below show the (i) historical and forward price and (ii) relative relationship data on individual graphs:
The Avalon Advantage – Visit our website at www.avalonenergy.us, call us at 888-484- 8096, or email us at jmcdonnell@avalonenergy.us.
Copyright 2012 by Avalon Energy® Services LLC