Natural Gas Market Update
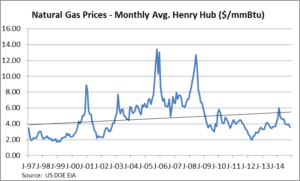
The above graph looks at natural gas prices going back to January 1997.
Natural gas prices have retreated from the Polar Vortex bump and remain relatively low by historical standards.
The prices plotted above are not adjusted for inflation. If they were in 2014 dollars, the left side of the curve would be more elevated. In real dollars, today’s prices are lower than they appear on the graph.
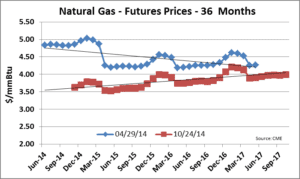
Looking to the futures market, the effects of the Polar Vortex lingered into the summer over concern about whether or not there was sufficient supply of natural gas to refill storage after the dramatic drawdowns during January and February.
This is highlighted on the left side of the blue line above which plots the 36 month futures curve as of 4/29/14. This curve is backwardated, meaning the months close in time were priced above the months further out in time.
The near dated months have since retreated as concerns about storage refill have diminished because of (a) greater natural gas production than expected, and (b) unusually mild summer weather reducing summer time electricity load and the related reduced demand for natural gas.
This is highlighted on the red line above which plots the 36 month futures curve as of 10/24/14. The months closer in time have declined significantly with the December ’14 contract down $1.26/mmBtu or 25%. The entire curve has declined as well, though to a lesser extent. The futures curve is no longer backwardated.
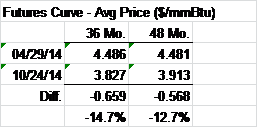
The table above shows the simple average of the monthly prices of the 36 and 48 month forward curves as of 4/29 and 10/24.
Overall, the 36 month futures curve is down 14.7% while the 48 month curve is down 12.7%.
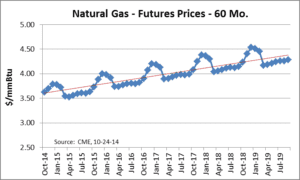
The graph above looks further ahead at the 60 month futures curve which indicates that the market expects prices to rise.
While the curve is upward sloping, five years into the future, natural gas is trading well below $5/mmBtu.
Summary:
Over the past six months, market sentiment has swung from concerns that natural gas supply cannot keep up with storage injections – and upcoming winter demand – to the reverse. Now the talk is more about an oversupplied market. While there is low correlation between crude oil and natural gas prices, the recent decline in crude oil prices has contributed to overall bearish sentiment. Generally, the best time to go long is when the market sentiment is most negative. We may be approaching that point for natural gas.
The Avalon Advantage – Visit our website atwww.avalonenergy.us, call us at 888-484-8096, or email us atjmcdonnell@avalonenergy.us.
Notes:
Please feel free to share this article. If you do, please email or post the web link. Unauthorized copying, retransmission, or republication is prohibited.
Copyright 2014 by Avalon Energy®Services LLC