Day-Ahead and Real-Time Pricing in NYISO
We recently looked at the Day-Ahead and Real-Time electricity markets in PJM. The New York Independent System Operator (NYISO) also operates a two settlement process with Day-Ahead (DA) and Real-Time (RT) markets, which are the subjects of this article.
First some background.
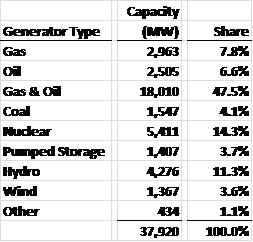
The NYISO, like only two other ISOs (CalISO and ERCOT), serves only one state. New York State has a population of 19.6 million people, 8.3 million of whom live in New York City. NYISO recorded its maximum summer peak load of 33,939 megawatts during 2006 and its maximum winter peak load of 25,541 megawatts during 2004/2005. NYISO is very dependent on natural gas as a fuel source and minimally dependent on coal. The make-up of generation in NYISO is as follows:
The NY Control Area is broken up into 11 Load Zones, labeled A through K. Across the state, electric power generally flows from west to east and from north to south.
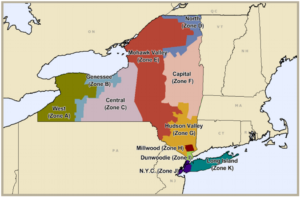
New York Independent System Operator – Control Area Load Zones
Roughly a third of the load in NYISO is located in Zone J (New York City). The next highest load areas are Zone K (Long Island) and Zone C (Central, which includes Syracuse and Ithaca). The remaining eight zones account for less than 50% of the total load in NYISO. See the tables below:

With so much load concentrated in Zones J (NYC) and K (Long Island), and with most of the electricity generation located outside of these zones, energy supply in these two zones is often constrained, leading to higher pricing. We will see this later.
The Day-Ahead market is a forward market in which hourly Locational Based Marginal Prices (LBMP) are calculated for the next operating day based on generation offers, demand bids, and scheduled bilateral transactions. The Real-Time market is a spot market in which current LBMPs are calculated at five-minute intervals based on actual grid operating conditions. The Real-Time market is also referred to as a “balancing market.”
The following analysis is based on NYISO hourly pricing data over the two year period ending June 30, 2013–a total of 17,544 hours.
The table below summarizes, by zone, hourly pricing in the NYISO Day-Ahead market.

Zones J (NYC) and K (Long Island) have higher average pricing and significantly higher variance in pricing than other zones, as highlighted by their maximum and minimum values.
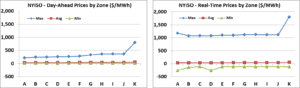
The table below summarizes hourly pricing data for the Real-Time market.

Average pricing in the Real-Time market is about the same as in the Day-Ahead market. However, the variability in prices in the Real-Time market is much greater across the board. This stands out graphically as shown below.
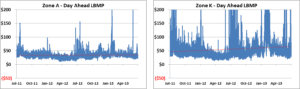
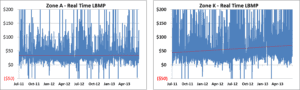
The following graphs plot all 17,544 hourly Day-Ahead prices for both Zone A (West) and Zone K (Long Island). The vertical scales are kept constant for comparison purposes. The red lines on each graph are trend lines.
And, the two graphs below plot all 17,544 Real-Time prices for both zones.
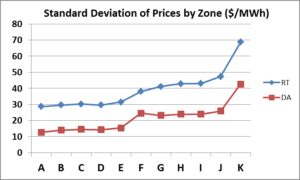
Another way to look at this volatility is to examine the standard deviation of prices. The results are presented on the graph below. Comparing Zone K to Zone A, Day-Ahead prices were 3.4 times more variable in Zone K and Real-Time prices were 2.4 more variable in Zone K.
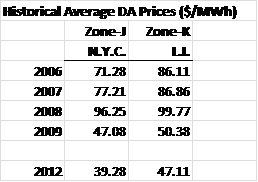
Separate from the level of volatility, especially in Zones J and K, average prices in all of the zones have fallen considerably in recent years. Average prices in Zone J and Zone K are less than half what they were in 2008.
Conclusions:
Real-Time prices are more volatile than Day-Ahead prices.
Zone J (NYC) and Zone K (Long Island) prices are more volatile than those of the other nine zones in the NY Control Area.
Notes:
– The New York Independent System Operator (NYISO) is a not-for-profit corporation that began operations in 1999. The NYISO operates New York’s bulk electricity grid, administers the state’s wholesale electricity markets, and provides comprehensive reliability planning for the state’s bulk electricity system.
– Underlying data and the control area map are from the New York Independent System Operator.
– Evelyn Teel contributed to this article.
The Avalon Advantage – Visit our website at www.avalonenergy.us, call us at 888-484- 8096, or email us at jmcdonnell@avalonenergy.us.
Please feel free to share this article. If you do, please email or post the web link. Unauthorized copying, retransmission, or republication is prohibited.
Copyright 2013 by Avalon Energy® Services LLC