Day-Ahead and Real-Time Pricing During a Heat Wave
PJM operates two markets for energy, the Day-Ahead (DA) Market and the Real-Time (RT) Market.
PJM’s Day-Ahead Market is a forward market in which hourly LMPs (locational marginal prices) are calculated for the next operating day based on generation offers, demand bids, and scheduled bilateral transactions.
PJM’s Real-Time Market is a spot market in which current LMPs are calculated at five-minute intervals based on actual grid operating conditions.
How do the two markets relate? Let’s use July 19, 2013 as an example.
During the day before (July 18), load serving entities (electric distribution companies and retail energy providers) submit to PJM their electricity usage forecasts for their load during July 19. These forecasts, provided in one hour increments, together represent the aggregate PJM demand forecast for the delivery day, July 19.
Also, during the day before (July 18), electricity generators submit to PJM offers to supply energy during the delivery day, July 19. These offers, also provided in one hour increments, together represent the total pool of supply PJM has available to match supply to demand. Offers are zone specific.
Through its “least cost” dispatch model, PJM then sorts through the generators’ offers, accepting, for each one hour period for the delivery day, the least expensive offers first and then incrementally more expensive offers until it has enough supply to meet the forecasted demand.
As a great simplification, offers for the hour ending (HE) 1400 in the ComEd Zone may have looked something like this:
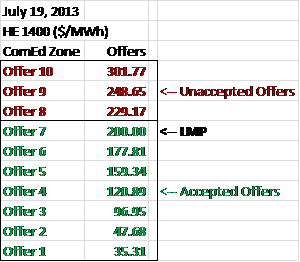
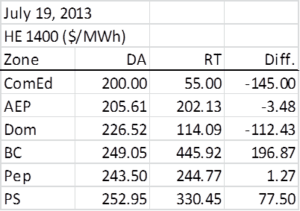
Below is a sample of actual accepted offers by selected zone for the July 19 hour ending 1400:
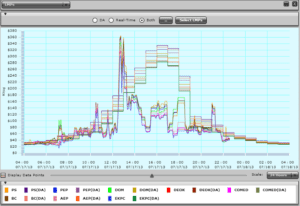
The graph below shows the Locational Marginal Prices (or the highest accepted offers) for each of the 24 hours of July 19 by selected zone. Note that the vertical scale spans $0 to $240.
Then, reality happens. Despite the best efforts on the part of retail energy providers to project usage, actual demand levels vary. The weather is cooler or warmer than expected, commercial and industrial facility activity levels differ from what was projected, transmission lines become congested, substations fail.
Forecasted and actual (instantaneous) demand for July 19 is shown below:
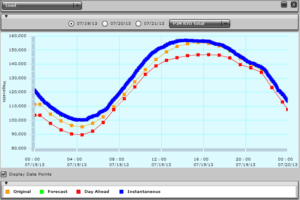
Demand for electricity within PJM peaked at 156,944 megawatts at hour 1420 (2:20 pm).
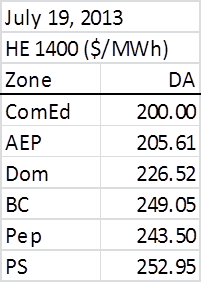
During the delivery day, when actual demand is greater or less than what was procured in the Day-Ahead Market, energy is purchased or sold in the Real-Time Market to instantaneously match supply and demand. Prices in the Real-Time Market during the hour ending 1400 were as presented below. Note that in some zones the Real-Time price is higher than the zonal Day-Ahead price while at the same time, in other zones, the Real-Time price is below the Day-Ahead price.
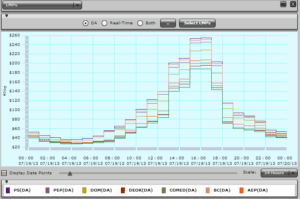
Prices in the Real-Time Market over the full 24 hours of the delivery day of July 19 for select zones are presented below. The vertical scale now spans $0 to $500.
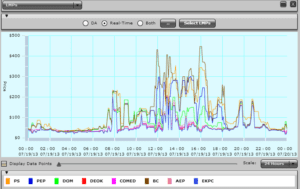
Because prices are set every five minutes, prices in the Real-Time Market are more volatile than in the Day-Ahead Market, where they are set on an hourly basis.
In the Mid-Atlantic, July 19 was the fifth day of a heat wave.

Below is a contour map of Locational Marginal Prices as of 1605 (4:05 PM).

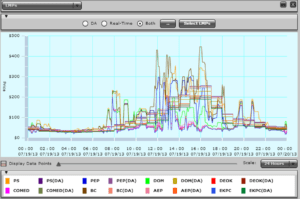
Below are both Day-Ahead and Real-Time prices during July 19, presented on one graph.
During this day, Real-Time prices were often higher than Day-Ahead prices. This is not always the case. Below is a graph of Real-Time and Day-Ahead prices during July 17, 2013.
Notes:
– “PJM” refers to the PJM Interconnection, which is a Regional Transmission Organization and operates the electric transmission system serving all or parts of Pennsylvania, New Jersey, Maryland, Delaware, the District of Columbia, Illinois, Indiana, Kentucky, Michigan, North Carolina, Ohio, Tennessee, Virginia, and West Virginia.
– Surface Heat Index map from Plymouth State Weather Center.
– Other data, maps and graphs from PJM.
– Evelyn Teel contributed to this article.
The Avalon Advantage – Visit our website atwww.avalonenergy.us, call us at 888-484- 8096, or email us at jmcdonnell@avalonenergy.us.
Please feel free to share this story. If you do, please email or post the web link. Unauthorized copying, retransmission, or republication is prohibited.
Copyright 2013 by Avalon Energy® Services LLC