What Does a Superstorm Look Like?
In previous blog posts, we have examined how weather and other events affect electricity prices.
What Does a Derecho Look Like?
What Does a Warm Day Look Like?
What Does an Earthquake Look Like?
We continue this series by looking at how Superstorm Sandy impacted electricity prices in the PJM service area.
After marching northward off the shore of the Atlantic coast, almost 1,000 mile wide Hurricane Sandy became Superstorm Sandy. She made a sharp left turn and headed due west. The eye of the storm, along with its tidal surge and 90 mile per hour winds, then made landfall in southern New Jersey around 6:30 PM on Monday, October 29, 2012.
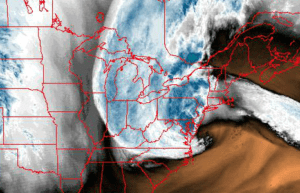
The storm’s destructive winds caused extensive damage to property along its path. This damage led to large and rapid reductions in electric load, first in New Jersey, the Delmarva Peninsula and New York, and soon thereafter, elsewhere in the Northeast.
As the storm approached land, the locational marginal prices (LMP) of electricity in the Mid Atlantic were about $40 to $50 per megawatt-hour.After landfall, in the areas where the hurricane hit hardest in PJM – New Jersey and the Delmarva Peninsula – LMPs dropped dramatically and turned negative. The image below is of a contour map of LMP prices in PJM at 9:10 PM on Monday, October 29.
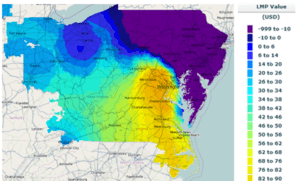
The phenomenon of negative LMPs occurs from time to time, but is infrequent. Negative LMPs rarely drop so far, across such a wide area, and for such an extended period of time as occurred here. Negative LMPs even backed up into eastern and northern Pennsylvania. The areas that were less affected by the storm, such as mainland Maryland and Virginia, maintained more normal LMP levels.
The graph below shows select PJM LMPs over the course of the entire day (midnight to midnight, Monday, October 29), before and after landfall of Superstorm Sandy.
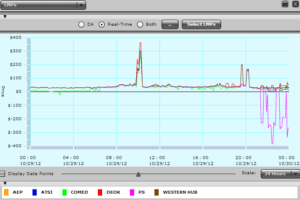
Electricity prices remained fairly steady overall within PJM over the course of the day, with a peak occurring around 10 AM. After the eye of the storm hit land, LMPs in the PSEG Zone (the largest electric utility in New Jersey) first spiked upwards and then turned negative for more than three hours. At one point, LMPs in the PSEG Zone approached negative $400 per megawatt-hour (see pink line above).
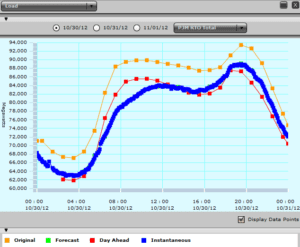
System wide, load within PJM declined as the storm approached, landed and barreled into New Jersey, Delaware, Pennsylvania and New York. This progression can be seen by the steepness of the change in instantaneous demand starting around 6 PM on the blue curve below.
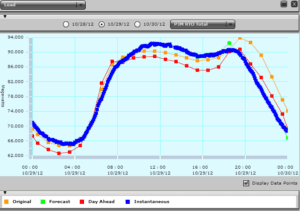
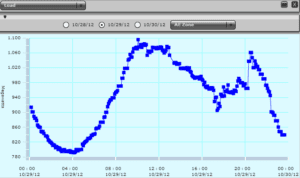
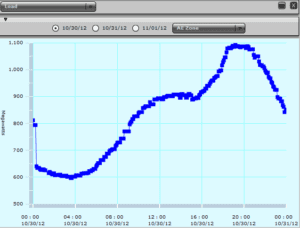
Closer to the eye of the storm, in the Atlantic City Electric Zone (AE Zone), load began to fall off starting around 10 AM, continued to drop throughout the afternoon, showed some short lived recovery around 8 PM, and then fell precipitously thereafter.
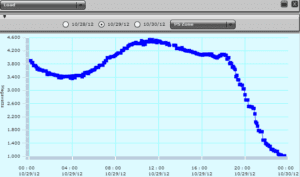
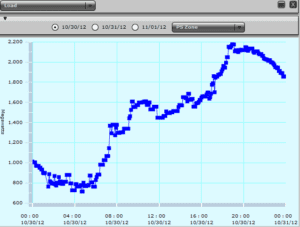
Further north and west in New Jersey, in the Public Service Electric and Gas Zone (PS Zone), load similarly exhibited a slow fall off after noon and then a rapid decline starting around 6 PM.
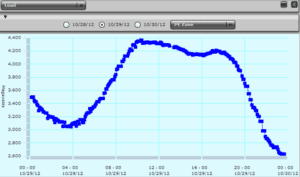
In the Philadelphia Electric area, (PE Zone) load peaked at about 10 AM, slowly declined at first, and then also dropped off sharply starting around 6 PM.
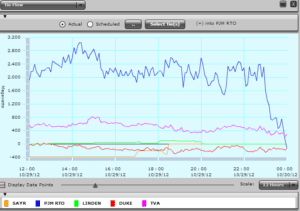
The graph below shows the impact of Superstorm Sandy on the movement of power into and out of the PJM grid. During most of the day, PJM was importing about 2,200 MW and continued to do so until about 10:30 PM when, the need for power greatly reduced, imports from adjacent grids fell dramatically.
The following day, Tuesday, October 30, LMPs were volatile and mostly positive as shown on the graph below. This volatility was caused by the episodic restoration of generation, transmission lines, and sub-stations and distribution lines.
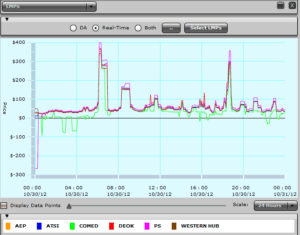
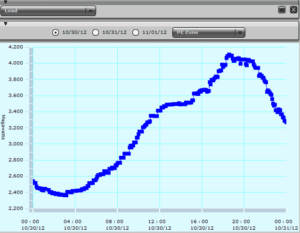
The overall decline in load PJM-wide and its subsequent slow recovery can be seen on the graph below.
This graph shows the AE Zone slowly recovering.
Load in the PS Zone also recovered slowly but in an even more sporadic manner.
Load recovery in the PE Zone followed a similar pattern.
Conclusion
The high winds,rain and tidal surge associated with Superstorm Sandy caused devastation to a large area of the Northeast. Negative LMPs are generally short lived, transitory phenomena. The magnitude of the initial damage caused by Superstorm Sandy can be seen by the highly negative LMPs that occurred over such a wide area, and for such an extended period of time. This was a result of rapid decline of load and the inability of supply to be ramped down quickly to match the reduced level of load.
Notes:
– “PJM” refers to the PJM Interconnection, which is a Regional Transmission Organization and operates the electric transmission system serving all or parts of Pennsylvania, New Jersey, Maryland, Delaware, the District of Columbia, Illinois, Indiana, Kentucky, Michigan, North Carolina, Ohio, Tennessee, Virginia, and West Virginia.
– Satelite image from www.weather.com.
– Other data and maps from PJM.
– David White and Evelyn McDonnell contributed to this article.
The Avalon Advantage – Visit our website at www.avalonenergy.us, call us at 888-484- 8096, or email us at jmcdonnell@avalonenergy.us.
Copyright 2012 by Avalon Energy® Services LLC
