Time to Draw Down the Strategic Petroleum Reserve? – Part 2
It has been argued that there is too much crude oil in the Strategic Petroleum Reserve and that it should be drawn down. Arguments have been made that one should “tie the amount of insurance you carry to the size of the need.” By that argument, because domestic production is up and “hit record levels in 2011,” and imports “have dropped by more than 20% since 2006,” the reserve is “just too big and full” (see note 1). It has also been claimed that over the first 30 years of the SPR’s existence, “its volume averaged fewer than 550 million barrels – 75% of capacity” (see note 2).
Background
The creation and stocking of the US Strategic Petroleum Reserve was enabled by the Energy Policy and Conservation Act of 1975 (EPCA). The EPCA stated that the purpose of the Act was “…to provide for the creation of a Strategic Petroleum Reserve capable of reducing the impact of severe energy supply interruptions.” See previous discussion concerning the SPR here.The SPR can hold a total of 727 million barrels of crude oil and is currently at 96% capacity.
Over time, how much crude has been held in the SPR?
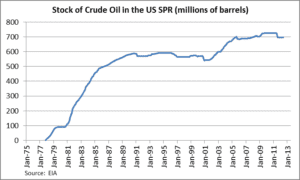
The graph below shows the stock of crude oil in the SPR since its creation.

Over its life, the SPR has held an average of 519 million barrels of oil, which is 72% of its capacity. As you can see on the graph, it took many years to construct and fill the SPR. In fact, it was as recently as December 27, 2009 that the SPR actually reached its full capacity of 727 million barrels. However, the many years it has taken to fill the SPR isn’t relevant concerning the working level for which it was designed. The SPR was intentionally filled slowly so as to not appreciably affect the market price of petroleum products. This has been accomplished in part by using royalty-in-kind crude oil from US Outer Continental Shelf leases. In 2005, EPCA was amended to increase the size of the SPR to one billion barrels, in part as recognition that US crude oil consumption has increased since 1975. Efforts to expand the SPR to one billion barrels were suspended in 2011.
How exposed are we to foreign imports?
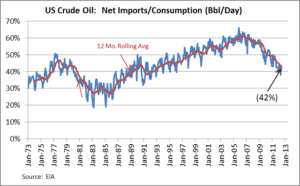
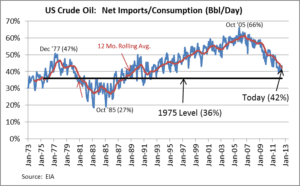
Today, crude oil imports represent 42% of US consumption. The graph below shows the ratio of net imports to US consumption plotted over time.

In 1975, when the Energy Policy and Conservation Act was enacted, crude imports represented 36% of total US consumption. After that, imports rose to 47% during December 1977, declined to 27% in October 1985, and then generally rose again to a peak of 66% during October 2005. Since October 2005, imports have fallen to 42%.

Conclusion
While it is accurate to say that imports have fallen from a high of 66% to 42% today, imports are still above 36%, the level of imports that existed at the time EPCA was enacted in 1975. While US dependence on crude oil imports has dropped over the last seven years, today it is greater than it was in 1975. Relying on the original intent when the SPR was established, there is no need to draw down the SPR.
Note 1 – Opinion piece by Austan D. Goolsbee in the The Wall Street Journal, April 10, 2012.
Note 2 – IBID.
The Avalon Advantage – Visit our website at www.avalonenergy.us, call us at 888-484- 8096, or email us at jmcdonnell@avalonenergy.us.
Copyright 2012 by Avalon Energy® Services LLC
