Time To Draw Down The Strategic Petroleum Reserve?
The Strategic Petroleum Reserve consists of a number of large underground caverns created in naturally occurring salt diapirs (domes) along the Gulf Coast of the United States. The caverns were created by drilling wells into the salt domes, dissolving the salt with water, pumping the salt water solution to the surface and disposing of the solution.

The creation of the SPR was enabled in 1975 by the Federal government in response to the 1973-74 Middle East oil embargo. More specifically, the Energy Policy and Conservation Act of 1975 stated the purpose was “…to provide for the creation of a Strategic Petroleum Reserve capable of reducing the impact of severe energy supply interruptions.” Maintained by the US Department of Energy, the SPR, with about 700 million barrels of capacity, is the world’s largest government-owned emergency crude oil stockpile.
The Energy Policy and Conservation Act defines “severe energy supply interruption” as “… a national energy supply shortage which the President determines – (A) is, or is likely to be, of significant scope and duration, and of an emergency nature; (B) may cause major adverse impact on national safety or the national economy; and (C) results, or is likely to result, from (i) an interruption in the supply of imported petroleum products, (ii) an interruption in the supply of domestic petroleum products, or (iii) sabotage or an act of God.”
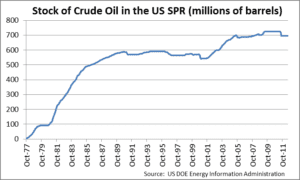
The SPR currently holds about 700 million barrels of crude oil and is about 96% full. With a maximum draw down rate of about 4.5 million barrels per day, at the US’s current consumption rate of 18.7 million barrels per day, the SPR could supply about 24% of our domestic needs for a little more than five months.
There have been seven petroleum sales from the SPR, four of them significant:

In addition, there have been 10 petroleum loans made by the SPR. Loans are made to oil companies to help resolve logistical problems. Oil is returned to the SPR along with additional oil as interest.
Stocks of crude oil in the SPR over time are graphed below:
What do the fundamentals look like in the crude oil market?
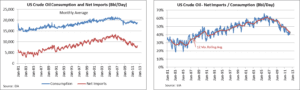
Currently the US market for crude oil is adequately supplied. According to the Energy Information Administration, demand for crude oil in the US is expected to decline again this year to a 15 year low of 18.7 million barrels per day. At the same time, US crude oil production continues to rise. Crude oil production in North Dakota alone was nearly 700,000 barrels per day this past June, up from 350,000 barrels per day in January 2011. For a strong indicator of how adequately supplied the market is, look at the market’s response to Hurricane Isaac. Crude oil prices rose some, but not much. Previous hurricanes in the US Gulf Coast, or even the threat of hurricanes, have driven prices up significantly.
Are there any supply disruptions in the world oil markets?
Sanctions against Iran have led to a decline in Iranian output to about 2.5 million barrels per day, down from 3.5 million barrels per day at the beginning of 2012. At the same time, Iraqi oil production continues to recover. For the first time in over 20 years Iraqi production this summer was greater than Iranian production – 3 million barrels per day versus Iran’s 2.9 million barrels per day. Last month Saudi Arabia produced as much as 9.9 million barrels per day, and has indicated that it may increase production to 10 million barrels per day, a 30-year high.
International supply disruptions have become less of a threat to the US economy. The US currently imports about 42% of its crude oil. This is down from more than60% as recently as 2006.And, the EIA expects imports to drop again in 2013 to 39%. This would be the first time US imports have been below 40% since 1991.
So, if the market is adequately supplied, and supply disruptions are not an issue, why are crude oil prices elevated?
First, monetary easing on the part of the Federal Reserve has led to higher crude oil prices. Crude oil is traded in dollars. As the US money supply increases, the value of the US dollar relative to other world currencies declines. Non-US oil companies have to raise their price in dollar terms just to keep the economics even in their home currencies.
The second driver is geopolitical risk. Tensions in the Middle East play a role as oil consumers and traders tend to increase inventories (increase demand) as a protective measure in the event that there is a disruption of supply. This risk tends to drive up spot crude oil prices as well as the short end of the crude oil forward curve.
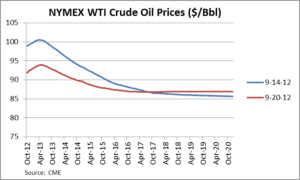
A good way to see the interplay between the seemingly opposing states of (a) adequately supplied crude oil markets and (b) elevated crude oil prices is to look at the forward curve. Only the short end of the forward curve has risen. Beyond May 2013 (8 months), the forward curve is downward sloping, meaning the market expects crude oil prices to decline in the future. Interestingly, the short end of the forward curve fell more than 7% over the past trading week. See graph below.
Is there good reason to draw down the SPR?
There are no “severe energy supply interruptions,” and market fundamentals are supply heavy. US crude oil production is up and continues to rise. Imports to the US have declined and continue to do so. There is more than adequate supply in the market to offset reduced exports from Iran. While there may be many political reasons to draw down the SPR, there are currently no strategic reasons to draw down the SPR based on market fundamentals.
The Avalon Advantage – Visit our website at www.avalonenergy.us, call us at 888-484- 8096, or email us at jmcdonnell@avalonenergy.us.
Copyright 2012 by Avalon Energy® Services LLC