What does a warm day look like?
What does a warm day look like?
Here are several ways of looking at one particularly warm day – June 21, 2012.
The blue line on the graph below shows instantaneous electricity demand in PJM (see note 1).
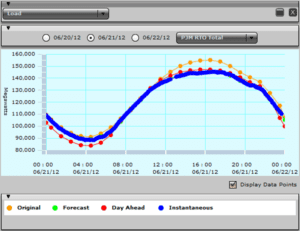
Electricity demand ebbed to 88,367 megawatts at 4:25 AM and then began to rise as temperatures in the Mid-Atlantic climbed into the upper 90s. Overall demand in PJM peaked at 145,331 megawatts during the late afternoon at 4:55 PM.
The graph below plots the Locational Marginal Price (LMP) for various zones and nodes within the PJM Interconnection footprint over the 24 hour period of time spanning 6 PM June 20 to 6 PM June 21.
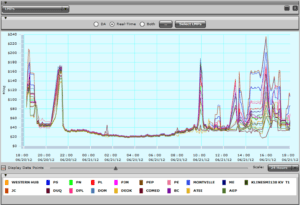
LMPs don’t follow the same smooth path overall demand follows.
Generation is concentrated on the western side of the power grid and demand is concentrated in the East in the load centers stretching from northern New Jersey through Philadelphia and Baltimore to Washington, DC. As a result, power generally flows from West to East through the high voltage transmission network.
The grid operator has many tools at its disposal to match supply to demand. These tools include generation (base load, intermediate, peaking, and intermittent sources), spinning reserve, and demand response. And, they need all of them. As they match supply with demand, electrical, mechanical, and operational constraints intervene. Generators trip. Transmission lines reach their capacity. Thermal limits become exceeded. The sun and wind start and stop shining and blowing. Load jumps up and down. Because electricity cannot be stored in meaningful quantities, imbalances between supply and demand are reflected immediately in the price of electricity in the form of LMPs.
Looking again at the graph above, for almost half of the 24 hour period, LMPs ranged between $20 and $40 per megawatt-hour (MWh). As temperatures rose driving up demand, the electric grid became more and more stressed, and LMPs became more and more volatile.
Peak prices occurred at 3:50 PM. Prices at that moment averaged $105.11/MWH and were as low as $19.69 in the Commonwealth Edison zone and as high as $235.46 in the Jersey Central zone. The table below shows LMPs at the same point in time for several zones.
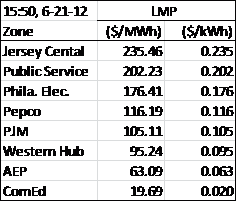
Prices are considerably higher in the Eastern part of PJM, especially in New Jersey, reflecting the constraints associated with moving power into the area.
The maps below have overlain on top of them LMPs at various points in time during the day. These LMPs are color coded and contoured by price. Here is the price legend:

11:30 AM – Most of the grid between $26/MWh to $30/MWh (teal). Northern New Jersey at $68/MWh (yellow).

1:15 PM – Higher prices expand west out of New Jersey into Pennsylvania and also down the East Coast, ranging from $68/MWH to $115/MWh (yellow and light brown). Negative prices appear in southern Virginia (dark blue). This excursion only last 10 minutes.
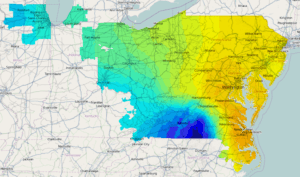
2:30 PM – Prices reach $250/MWh to $300/MWh in northern New Jersey (darker brown).

3:50 PM – $300/MWh to $400/MWh prices extend into Pennsylvania, northeast Maryland, and down the Delmarva Peninsula. Chicago enjoys $20/MWh energy.

5:35 PM – New Jersey and most of Pennsylvania back to $56/MWH to $62/MWH range. Locally, from Allentown to Philadelphia, prices are higher at $68/MWH to $76/MWh.

5:45 PM – Prices fall into the $34/MWh to $76/MWh range across the grid except for $200/MWh to $250/MWh excursion reaching in from the Southern Tier of New York.

The prices discussed above are wholesale prices. For comparison, Pepco residential customers are currently paying 8.6 cents per kilowatt-hour (the equivalent of $86 per megawatt-hour) for electricity supply. Of this amount, approximately 6 cents per kilowatt-hour represents the cost of energy ($60 per megawatt-hour). By comparing, on just this one day, prices in the wholesale market to those in the retail market, one can get a sense of the commodity price risk wholesale electricity suppliers take on when contracting to supply customers with fixed price energy.
Notes:
-“PJM” refers to the PJM Interconnection which is a Regional Transmission Organization and operates the electric transmission system serving all or parts of Pennsylvania, New Jersey, Maryland, Delaware, the District of Columbia, Illinois, Indiana, Kentucky, Michigan, North Carolina, Ohio, Tennessee, Virginia, and West Virginia.
-Data and maps from PJM.
The Avalon Advantage – Visit our website at www.avalonenergy.us, call us at 888-484- 8096, or email us at jmcdonnell@avalonenergy.us.
Copyright 2012 by Avalon Energy® Services LLC