Long Tailed Fish Swimming East
Markets adjust. There are perhaps few better examples of that adage than the crude oil and natural gas markets. One way of looking at how these two markets adjust is through the rotary rig count. Baker Hughes keeps track of the number of active drilling rigs in the US (and also internationally).
Since July 1987, the number of active drilling rigs in the US has been as low as 488 (April 1999) and as high as 2,031 (September 2008).
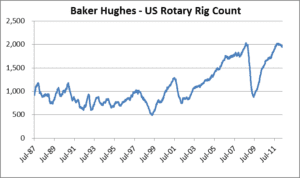
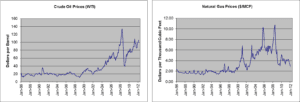
The September 2008 rig count peak occurred three months after crude oil and natural gas monthly average prices peaked at $133.88/barrel and $10.28/mcf, respectively. The rig count then followed the subsequent collapse of energy prices. Crude oil fell to $39.09/barrel by February 2009 and soon thereafter, the rig count bottomed at 876 rigs in June 2009. Since this bottoming in the rig count, the count has risen dramatically over the past three years to the current level of 1,945 active rigs. The following graphs present historical monthly average crude oil and natural gas prices.
Baker Hughes also classifies operating drilling rigs by their primary target – oil or natural gas. The rig count broken out by these two targets is depicted on the graph below.
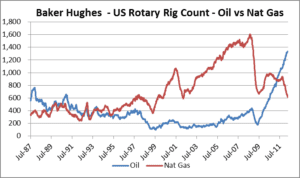
Since the total rig count bottomed out in June 2009, the contributions to this total number between oil and natural gas directed rigs have changed significantly. The number of natural gas directed rigs tracked the subsequent rise and fall of natural gas prices. The number of crude oil directed rigs, however, has been on a one way track upwards,paralleling the sustained run up in crude oil prices.

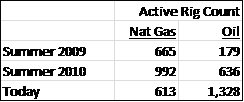
Compared to the summer of 2009, today there are 52 fewer rigs exploring primarily for natural gas and 1,149 more rigs exploring for crude oil.
The graph below shows the active US crude oil and natural gas rig count on a percentage basis.
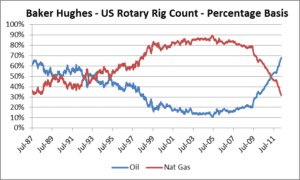
The change in focus from drilling for natural gas to drilling for crude oil has been a longer term trend, going back to the summer of 2005. Seven years ago, about one in ten rigs were focused on crude oil. Today, for more than two-thirds of the rigs, crude oil is the primary target.

So far we have looked at data back to 1987. During this period, today’s count of 1,945 active rigs is close to the 2,031 maximum. Looking back further in time, how does this compare?
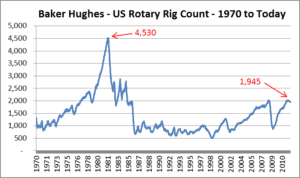
Today’s total rig count is less than half the 4,530 rigs that were operating during late 1981. Advances in drilling exploration techniques such as 3-D seismic, horizontal drilling and centralized drilling pads have increased success rates in exploratory drilling and increased drilling rig productivity.

The Avalon Advantage – Visit our website at www.avalonenergy.us, call us at 888-484- 8096, or email us at jmcdonnell@avalonenergy.us.
Copyright 2012 by Avalon Energy® Services LLC
