Best Friends? – Natural Gas and Electricity Prices
We have looked at historical and forward natural gas prices. How have electricity prices been behaving?

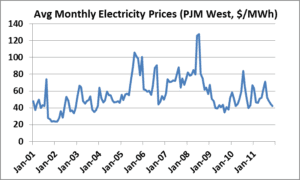
The graph above shows the monthly average of electricity prices at PJM West (a trading hub where electric generation is concentrated) spanning the 131 month period of time of January 2001 through November 2011. Like natural gas, electricity prices peaked during 2008, declined, recovered somewhat, and then declined again. The relationship between electricity prices and natural gas prices can be seen better in the graph below:

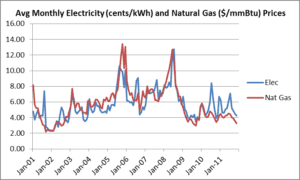
Please note that in this graph electricity prices have been converted to cents per kilowatt-hour. When plotted together, electricity prices and natural gas prices seem to track closely, and the reality is that they are closely related. In the Mid-Atlantic, electricity prices and natural gas prices are strongly correlated. Natural gas fired generating units are usually the marginal units called upon by the grid operator and, as such, set pricing in the wholesale markets. So, generally in the Mid-Atlantic, as natural gas prices go, so go electricity prices.
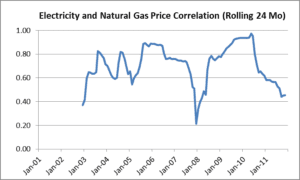
While electricity price and natural gas prices tend to move together, the relationship between the two does change over time.

The graph above shows the correlation on a rolling 24 month basis. Over this period, the correlation between electricity and natural gas averaged 71% but has been as high as 97% and as low as 21%. The weakest correlation was during 2008, when natural gas prices moved upward more vigorously than did electricity prices. After having moving up to 97%, the correlation has been declining over the last two years.

In the above graphs, you can see how over the last two years, electricity prices have recovered more strongly than natural gas prices, leading to declining correlations between the two.
The Avalon Advantage – Visit our website at www.avalonenergy.us, call us at 888-484-8096, or email us at jmcdonnell@avalonenergy.us.
Copyright 2012 by Avalon Energy® Services LLC
