Capacity Factor
In a recent article in the Energy Law Journal, the authors state,
By as early as 2016, installed distributed solar PV capacity in the United States could reach thirty gigawatts (GW). If that forecast is on track, distributed solar generation will have increased from less than one GW in 2010 to the equivalent of nearly one-third of the nuclear generating capacity in the United States in less than a decade.1
Is the comparison to “one-third of the nuclear generating capacity” meaningful? Could the amount of solar PV (photovoltaic) generation output expected to be available as early as within two years be equivalent to one-third of today’s nuclear generation output? The short answer to both questions is “no” and the reason is that nuclear and solar generating facilities have substantially different Capacity Factors.
What is Capacity Factor?
Capacity Factor is the ratio of the actual output of an electricity generating unit over a time period to the unit’s maximum possible output over the same time period. This ratio expresses the extent to which a unit is, or is not, operating at full output. A high Capacity Factor, say 80% or 90%, indicates that a generating unit is operating close to “full out,” whereas a low Capacity Factor, say 20% or 30%, indicates that a generating unit is operating well below its maximum capability.
More specifically, Capacity Factor is defined as follows:
![]()
For example, a 500 megawatt (MW) unit that generates 2,187,500 megawatt-hours (MWh) of energy during the course of a year has a Capacity Factor of 50%, calculated as follows:
Capacity Factor = 2,187,500 MWh / (500 MW x 8,760 hours/year)
Capacity Factor = 50%
Why don’t generating units operate at 100% Capacity Factor?
There are many reasons. All operating equipment must be backed off periodically for maintenance. Mechanical failures and accidents lead to unscheduled outages. The individual economics of each unit lead to them being called upon more or less under grid operators’ economic dispatch models. Wind and solar units are physically constrained by how frequently the wind blows and the sun shines.
US Nuclear Generating Fleet
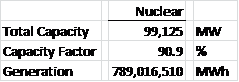
The current US nuclear generation fleet consists of 100 operating units with combined capacity of 99,125 MW which, during 2013, produced 789,016,510 MWh of electricity. The overall Capacity Factor of the nuclear generating fleet is therefore:
Capacity Factor = 789,016,510 MWh / (99,125 MW x 8,760 hours/year)
Capacity Factor = 90.9%
Analysis
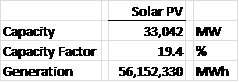
The Energy Information Administration (EIA) reports that during 2013, the average Capacity Factor of solar PV in the US was 19.4%.
Over the same time period, 99,125 MW of nuclear capacity, with its 90.9% Capacity Factor, generated 789,016,510 MWh of electricity:
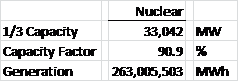
Going back to the opening quote, “…one-third of the nuclear generating capacity in the United States” is 33,042 MW, which was responsible for 263,005,503 MWh of electricity:
Given Solar PV’s much lower Capacity Factor, 33,042 MW of solar PV capacity would generate only 56,152,330 MWh of electricity, or 206,853,173 MWh (78%) less than the output of the same amount of nuclear capacity:
In order to generate an equivalent amount of electricity as 33,042 MW of nuclear capacity, substantially more solar PV capacity would be required:
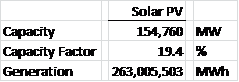
In other words, in addition to the 33,042 MW of solar PV capacity projected to be online by as early as 2016, another 121,718 MW of solar PV would be required in order to generate the same amount of electricity as 1/3 the output of the nuclear generation fleet:
Is the amount of solar generation expected to come online in a decade equivalent to one-third of today’s nuclear generation capacity? No, and the reason is that nuclear and solar generating facilities have substantially different Capacity Factors, 90.9% versus 19.4%, respectively.
This is a challenge solar PV faces. The nuclear industry increased its capacity factor from 50% during the 1950s to what it is today through operational improvements. The capacity factors of coal and natural gas units vary based on their individual economics and their dispatch merit. Solar PV is bounded by the physical limits of when the sun shines.
The purpose of this article is to take a recent quote and use it as an opportunity to explain Capacity Factor. Solar PV, like other sources of electricity generation (nuclear, wind, coal, natural gas, geothermal, biomass, etc.) comes with a set of tradeoffs. Each source has its own strengths and weaknesses. The article is meant simply to look at Capacity Factor. Other tradeoffs will be the subject of future articles.
The Avalon Advantage – Visit our website atwww.avalonenergy.us, call us at 888-484-8096, or email us atjmcdonnell@avalonenergy.us.
Notes:
1Elisabeth Graffy and Steven Kihm, Does Disruptive Competition Mean a Death Spiral for Electric Utilities?, Energy Law Journal, Volume 35, No, 1, 2014.
Data from the US Energy Information Administration.
Evelyn Teel contributed to this article.
Please feel free to share this article. If you do, please email or post the web link. Unauthorized copying, retransmission, or republication is prohibited.
Copyright 2014 by Avalon Energy® Services LLC