Natural Gas Prices – Time to Hit the Panic Button?
Over the last 25 days, the daily spot price of natural gas at the Henry Hub has risen more than 30%. This is a dramatic percentage increase over a short period of time. Is it time to hit the panic button? No. In short, the percentage increase is so large because the base has gotten so small.
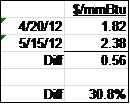
There has been much reporting in the press recently about how natural gas prices are at ten year lows. While this is accurate, it does not fully convey how truly low natural gas prices have fallen. The graph below shows daily spot natural gas prices since January 1997.
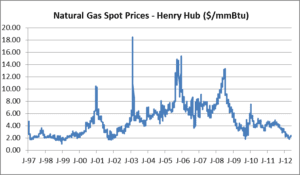
Over this 184 month period of time, the daily spot price has been as high as $18.48/mmBtu (2/25/03) and as low as $1.05/mmBtu (12/04/98). The median price was $4.37/mmBtu.

The cumulative distribution graph below shows these historical prices.
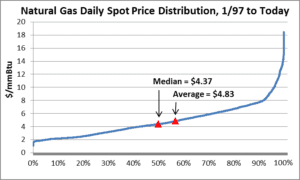
For each price point, the graph shows how often prices have been at this point or lower. For example, prices have been at or below $18.48/mmBtu 100% of the time and at or below $4.37/mmBtu 50% of the time.
The recent 4/20/12 low of $1.82/mmBtu is highlighted on the cumulative distribution graph below.
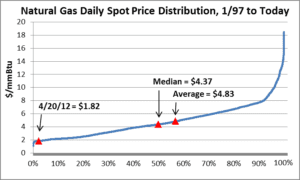
Over the study period, daily spot prices have been at or below $1.82/mmBtu ONLY 2.2% OF THE TIME. This is an infrequent occurrence by historical standards.
The 5/15/12 daily spot price of $2.38/mmBtu is now highlighted on the graph below.
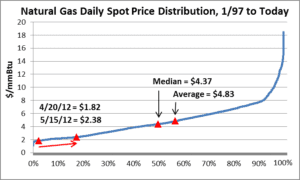
Prices have been below this price only 17.4% of the time. Thought of another way, prices have been greater than $2.38/mmBtu 82.6% of the time.
While daily natural gas prices have run up, they are still low.
Notes:
– Data are from the U.S. Department of Energy , Energy Information Administration
– Prices are in nominal terms and are not adjusted for inflation
The Avalon Advantage – Visit our website at www.avalonenergy.us, call us at 888-484- 8096, or email us at jmcdonnell@avalonenergy.us.
Copyright 2012 by Avalon Energy® Services LLC
