These Are Days To Remember
Natural gas prices are really, really low in the wholesale market.
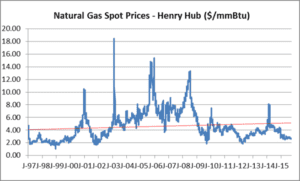
The graph above shows daily natural gas prices traded at the Henry Hub, in dollars per million British thermal units ($/mmBtu), from January 1997 to today. Prices on the graph are in nominal dollars, not adjusted for inflation. Natural gas prices have exhibited a great deal of volatility. The average price over this period is $4.60 per mmBtu and the long-term trend is upward sloping as shown by the red line. This fits well with the widespread perception that energy prices always go up.
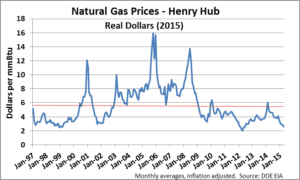
This graph shows prices on a monthly basis, which smooths out some of the volatility, but not much. Prices on this graph are in real dollars. Specifically, they have been converted to today’s (2015) dollars. After adjusting for inflation, the monthly average price is $5.53 per mmBtu and the long term trend is downward sloping. In other words, in real dollars, natural gas prices have declined over this period of time.
Why have prices declined? In a few words–the shale gas revolution.
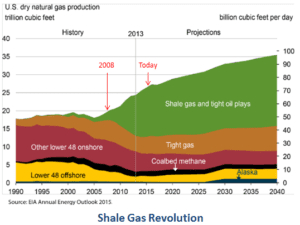
Until 2008, the contribution of shale gas production to total US natural gas production was small (see green area above). Since then, total natural gas production has risen dramatically. Even more dramatic is shale gas’ contribution to total US natural gas production which today is greater than 56%. The Energy Information Administration’s 2012 “Outlook” projected this level of contribution on the part of shale gas would not happen until 2035. Twenty years sooner than predicted, here we are.
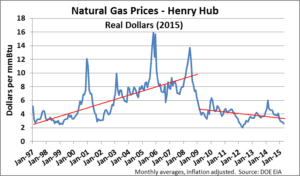
Using December 2008 as a demarcation point and splitting the data into two segments, we see two very different worlds. From January 1997 to December 2008, natural gas prices rose by more than 19% per year. Since then, they have fallen 5.7% per year.
Other commodities are experiencing declining prices recently. Iron ore and copper prices, for example, have dropped dramatically, primarily because of declining demand in China. Natural gas prices have declined in the face of rising demand. This is truly astounding.
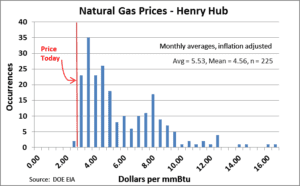
This frequency diagram shows how today’s prices compare to historical prices (all in real dollars). Natural gas prices are really, really low.
But, there is more to this story. First some background.
During World War II, two pipelines (the Big Inch and the Little Inch) were built by the US government to transport crude oil from the Gulf Coast to refineries in New Jersey. The pipelines allowed the oil to be transported by land, rather than by sea tankers (which were exposed to German U-boats) as had been the practice. After the war, these pipelines were sold to commercial enterprises and transformed to transport abundant and low cost Gulf Coast natural gas to Northeast industrial markets. Subsequently, other pipelines were built to move low cost natural gas from the Southwest to the pricier Northeast and Midwest markets.
The difference between the prices of a commodity at two different delivery points is known as basis. If Gulf Coast natural gas at the Henry Hub sells for $5.53 per mmBtu and sells for $6.53 in New Jersey, the basis differential is $1.00. And this is the way it was for many decades–natural gas in Northeastern markets trading at a basis (compared to the Henry Hub price) of a dollar or more. But things have changed.
Because of the immense increase in volume of natural gas being produced from the Marcellus Shale, natural gas for delivery in Pennsylvania and New York State, for example, sells for $1.50 or more below the Henry Hub price. This is a negative basis. Today, with natural gas trading around $2.60 per mmBtu at the Henry Hub, natural gas can be purchased for a little over a dollar per mmBtu in Pennsylvania and New York.
For energy buyers, these are days to remember. For natural gas producers, not so much.
Evelyn Teel contributed to this article.
The Avalon Advantage – Visit our website atwww.AvalonEnergy.US, call us at 888-484-8096, or email us atjmcdonnell@avalonenergy.us. Please feel free to share this article. If you do, please email or post the web link. Unauthorized copying, retransmission, or republication is prohibited. Copyright 2015 by Avalon Energy®Services LLC
See these related articles:
Real Electricity Prices (Energy Prices Always Go Up, (Part 5)
Energy Price Always Go Up (Part 4)
Energy Prices Always Go Up (continued)
Natural Gas Prices Continue to March Down