Natural Gas Market Update
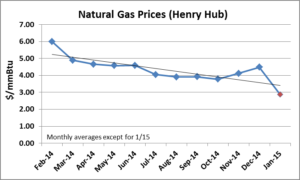
Over the past 12 months, natural gas prices have fallen 52%.
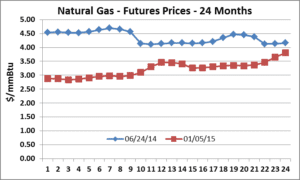
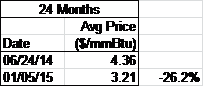
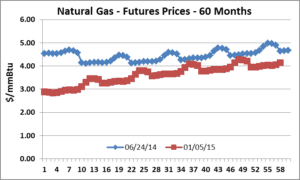
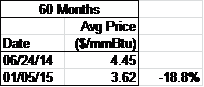
Looking ahead, the graphs below each look at natural gas prices in the futures market starting at two different points in time: June 24, 2014 and January 5, 2015. The first graph extends two years into the future and the second graph five years. The “average price” represents the simple average of all of the futures month prices in each series. Since June, natural gas prices over the future 24 months have fallen about 26% and over the future 60 months about 19%.
Natural gas (and electricity prices) are currently attractive making this a good time to consider locking in your supply needs.
The Avalon Advantage – Visit our website atwww.avalonenergy.us, call us at 888-484-8096, or email us atjmcdonnell@avalonenergy.us.
Please feel free to share this article. If you do, please email or post the web link. Unauthorized copying, retransmission, or republication is prohibited.
Copyright 2015 by Avalon Energy®Services LLC