What Does Volatility Look Like?
This article looks at how cold weather led to great volatility in real-time wholesale electricity prices during January 2014 in the PJM Interconnection (PJM).
The month of January 2014 was the coldest in decades in the US as a Polar Vortex pushed its way into the Midwest, South, and East.

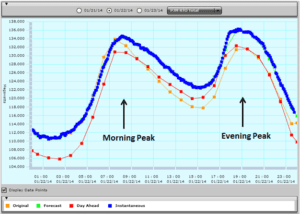
Winter electricity use in the Mid-Atlantic generally exhibits a daily bi-modal pattern, with morning and evening peaks. The graphic below shows total PJM load during the 24 hours of January 22, 2014.
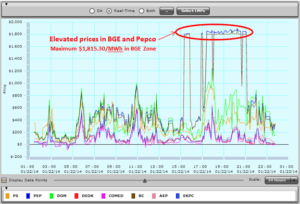
Because of the exceptionally cold weather on that day, during the morning and afternoon, real-time electricity prices were elevated, averaging about $350 per megawatt-hour. During the evening peak-demand period, as a result of the shutdown of the Calvert Cliffs Nuclear Power Plant’s two units, prices rose even more substantially. The two nuclear units, located on the western shore of the Chesapeake Bay in Calvert County, Maryland, together represent more than 1,700 megawatts of installed capacity. The outage was described by the facility’s owner, Constellation Energy Nuclear Group (now part of Exelon Corp), as the result of an electrical malfunction on the non-nuclear side of the plant. Regardless of the side of the plant on which the malfunction occurred, real-time prices in the transmission-constrained Potomac Electric Power Company (Pepco) and Baltimore Gas and Electric (BGE) Zones rose dramatically, for about a five hour period, reaching $1,890.70 per megawatt-hour in the Pepco Zone and $1,896.94 per megawatt-hour in the BGE Zone.
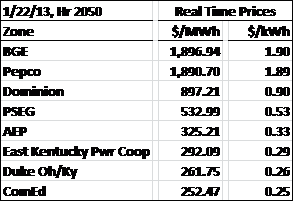
The table below presents real-time prices in eight of the twenty PJM zones at 2050 (8:50 PM). Real-time prices are shown in megawatt-hours ($/MWh) and kilowatt-hours ($/kWh). A map of all of the PJM Zones is presented at the end of this article.
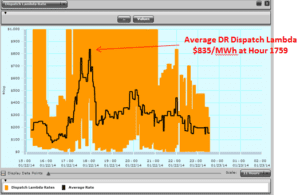
The grid operator, PJM, had been calling on demand response all day during January 22. The average demand response price (Average DR Dispatch Lambda) rose to $835 per megawatt-hour at hour 1759 (5:59 PM) as shown below.
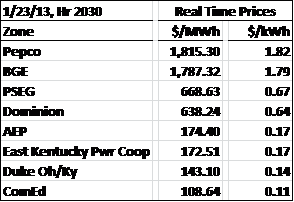
During January 23, 2014, as both the bitterly cold weather and the Calvert Cliffs outage continued, prices remained elevated, especially so in the constrained Pepco and BGE Zones. The table below presents real-time prices in eight PJM zones at 2030 (8:30 PM).
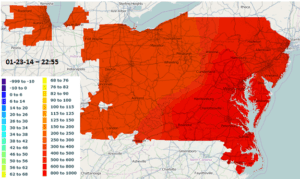
The contour map below shows real-time prices exceeding $550/MWh across all of the PJM zones at hour 2255 (10:55 PM).
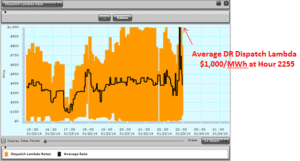
The average demand dispatch prices reached $1,000/MWh at the same time.
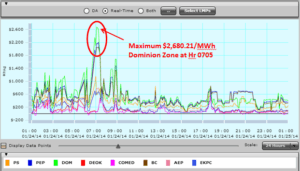
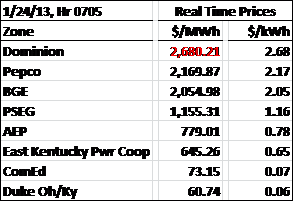
The following day, January 24, with the Calvert Cliffs outage continuing, real-time electricity prices exceeded $2,600/MWh in the Dominion Zone during the morning peak at 0705 (7:05 AM). Real-time prices previously set a record of $2,450.54/MWh in the Dominion Zone on January 7, 2014.
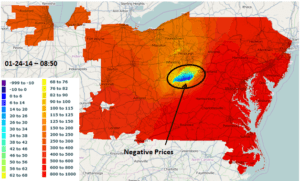
Less than two hours later, at 0850 (8:50 AM), due to a transmission constraint, a small portion of northern central West Virginia experienced negative prices while prices on the western side of PJM continued to exceed $200/MWh and on the eastern side exceeded $600/MWh.
Real-time price volatility continued within PJM in even more dramatic ways.
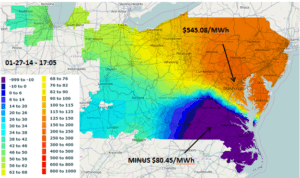
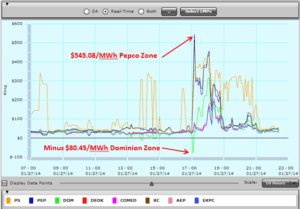
At 1700 (5 PM) on January 27, real-time prices in the Pepco Zone spiked to $545.08/MWh while real-time prices in almost the entire Dominion Zone dropped below zero to minus $80.45/MWh as shown on the price contour map below.
This volatility is shown on the graph and table below.
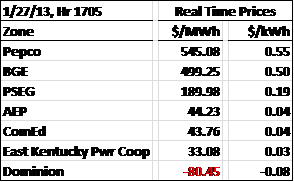
Volatility occurred not only in the real-time market but also in the day-ahead market. On January 28, day-ahead prices averaged about $600/MWh as shown here…
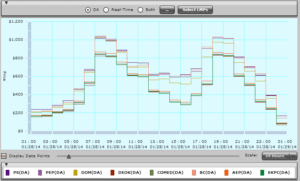
…while real-time prices averaged less than $400/MWh…
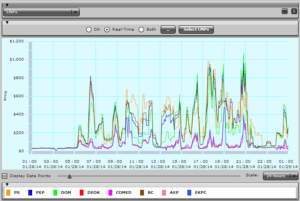
Putting This Into Perspective
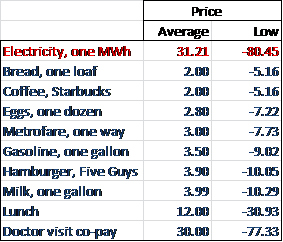
For comparison, real-time wholesale prices in PJM averaged $31.21/MWh during 2012. The peak high price of $2,680.21/MWh that occurred in the Dominion Zone on January 24, 2014 represents an 86-fold increase compared to the average. This is not an 86% increase but a multiple of 86 increase. This is the equivalent of walking into a convenience store to buy a gallon of milk and having the clerk tell you that yes, they do have milk, but because of current market conditions, they have to charge you $343 for a gallon. Comparisons to other everyday items are presented below:
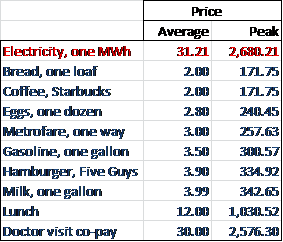
The low price of minus $80.45 per megawatt-hour that occurred during January 27, also in the Dominion Zone, represents a 2.6-fold decrease compared to the average. This is the equivalent of walking into a Starbucks and having the barista inform you that they have coffee, in fact too much coffee, and they will pay you $5.16 to take a cup away. Comparisons to other everyday items are presented below:
Conclusion
Wholesale electricity prices are volatile–more volatile than the price of virtually any other commodity.
The volatility of electricity prices during January 2014 shows how much risk purchasers of index electricity products take on. In a related fashion, it also shows how much risk retail energy providers take on when they do not effectively hedge their load.
It is likely that some retail energy providers will not survive this period of volatility.
For more on how electricity prices in the PJM Interconnection area can be affected by weather and other events, please see:
What Does an Extended Cold Spell Look Like?
What Does a Cold Day Look Like?
What Does a Superstorm (Sandy) Look Like?
What Does a Derecho Look Like?
What Does a Warm Day Look Like?
What Does an Earthquake Look Like?
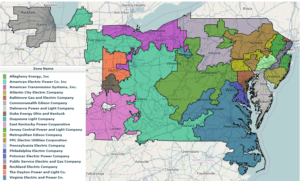
PJM is divided into twenty load zones. These zones are color coded on the map below:
The Avalon Advantage – Visit our website atwww.avalonenergy.us, call us at 888-484-8096, or email us atjmcdonnell@avalonenergy.us.
Note: Data and graphs from PJM.com
Please feel free to share this article. If you do, please email or post the web link. Unauthorized copying, retransmission, or republication is prohibited.
Copyright 2014 by Avalon Energy® Services LLC
