What Does an Extended Cold Spell Look Like?
This is a follow up to our blog posted Monday evening titled “What Does a Cold Day Look Like?” and looks at the impact on real-time wholesale electricity pricing of extended cold weather.
We reported that as a result of Winter Storm Hercules barreling through the Mid-West, Mid-Atlantic and Northeast last Thursday and Friday (January 3 and 4), real-time wholesale electricity prices in the PJM territory were elevated and volatile, ranging from negative prices to $739.70 per megawatt-hour ($/MWh) or $0.74 per kilowatt-hour (kWh). For comparison, we noted that real-time wholesale prices in PJM averaged $31.21/MWh or $0.0321/kWh during 2012. We also noted that during times of extremely cold weather, consumers pull out all of the stops. Air circulation equipment runs longer and electric resistance heating kicks in. The result is increased usage and high prices.
Moving ahead to Monday and Tuesday, January 6 and 7, the weather remained bitterly cold and the Polar Vortex moved further south.
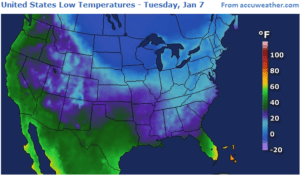
The difference during this later two day period was that thermal mass (such as building foundations and walls, and the ground itself) had largely dissipated any retained heat. The result was an increase in the amount of energy required to heat buildings and homes.
From 7:50 PM to 8:25 PM on Monday, January 6, real-time wholesale electricity prices exceeded $1,000/MWh across the entire PJM grid. As an indication of how far south the cold spell reached, the peak price for the day of $1,238.77, which occurred at 8:10 PM, was in the East Kentucky Power Coop Zone.
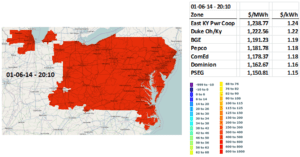
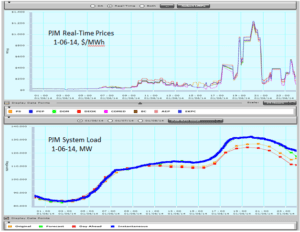
Below are PJM real-time prices and system load during the 24 hours of Monday, January 6.
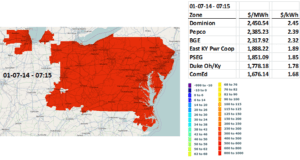
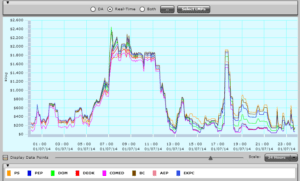
On Tuesday, January 7, real-time wholesale prices exceeded $1,000/MWH from 6:40 AM to 11:55 AM and then again from 5:30 PM to 5:55 PM. Prices peaked in PJM at 7:15 AM at $2,450.54/MWh. This occurred in the Dominion Zone.
Below are PJM real-time prices and total system load during the 24 hours of Tuesday, January 7. Peak system load was reduced significantly by voltage reductions, voluntary customer conservation, and the implementation of demand response. PJM reported 38,000 MW of generation outages. Additional electricity supply was imported from two other RTOs – NYISO and MISO.
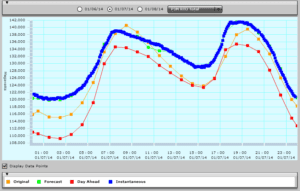
The table to the left below summarizes the PJM peak real-time wholesale electricity prices over the past four weekdays and shows the 2012 PJM total system average for comparison. The table to the right shows the PJM total system peak demand which, at 141,483 MW on Tuesday, 1/7/14, represents a new PJM winter record. The previous winter peak, which was about 5,000 MW lower, was set on 1/5/07. The all-time system summer peak of 158,450 MW occurred during the summer of 2011.

For more on how electricity prices in the PJM Interconnection area can be affected by weather and other events (i.e., an earthquake), please see:
What Does a Superstorm (Sandy) Look Like?
What Does a Derecho Look Like?
What Does a Warm Day Look Like?
What Does an Earthquake Look Like?
Post Script -A reader in Connecticut sent us the following image indicating that it is also what an extended cold spell looks like:

The Avalon Advantage – Visit our website atwww.avalonenergy.us, call us at 888-484-8096, or email us atjmcdonnell@avalonenergy.us.
Note: Data and graphs from PJM.com
Please feel free to share this article. If you do, please email or post the web link. Unauthorized copying, retransmission, or republication is prohibited.
Copyright 2014 by Avalon Energy® Services LLC

Interesting to see how high the prices got throughout PJM during the cold spell. I was really impressed with the previous blog in regard to now prices went negative in some portions of PJM but through the roof in others.