Natural Gas Prices – Looking Ahead
We have looked extensively at historical natural gas prices, both nominal and real. What does the market tell us about where natural gas prices may be headed in the future?
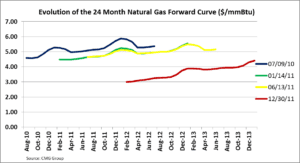
The above graph shows the monthly “forward curve” for natural gas at four different points in time. The forward curve represents the collective thinking of many, many market participants, both hedgers and speculators, who put real money on the line. While we know with a high degree of probability that actual natural gas prices will differ from those predicted by the forward curve, the forward curve is the best indicator of future prices that we have. Of course, the forward curve changes on a minute by minute basis as market sentiment changes.
The lines on the graph represent the market’s expectations for the price of natural gas for each of the following 24 months as of points in time during July 2010 (blue line), January 2011 (green line), June 2011 (yellow line) and, most recently, December 2011 (red line). Prices are expressed in dollars per million BTUs ($/mmBtu). These four points in time span approximately 18 months.
What do these curves tell us? Two observations stand out.
First, in each case, the curves are upward sloping, meaning that as of each of the four points in time, the market has expected natural gas prices to rise in the future. This is known as contango.
Second, over time, the forward curves have shifted downwards.
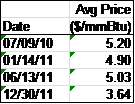
In fact, if we take the average price of each forward curve, over the 18 month period, as shown in the table above, the curves have declined by 30%, from $5.20/mmBtu to $3.64 mmBtu. This is a dramatic drop.
Looking at the July 2012 delivery month, eighteen months ago the market expectation for this month was $5.37/mmBtu (blue line). At the end of December 2011, the expectation for the same month was $3.24/mmBtu (red line).
It may seem counterintuitive, but while natural gas prices in the forward market have declined, the market still expects prices to rise in the future. Whereas during July 2010 natural gas was trading at $4.59 for the prompt month (the forward month nearest in time) and at $5.37 twenty-four months out, at the end of December 2011, the market was trading at $2.99 for the prompt month and at $4.42 twenty-four months out.
What does the forward market say about natural gas prices beyond 24 months?
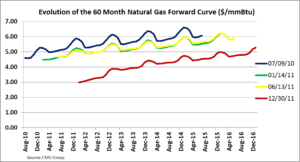
The above graphs shows the same four forward curves as above, but extended out to 60 months. The curves continue to be upward sloping, indicating that the market expects natural gas prices to rise.
Looking at the July 2015 delivery month, eighteen months ago the market expectation for this month was $6.07/mmBtu (blue line). At the end of December 2011, the expectation for the same month was $4.52/mmBtu (red line).
The most recent forward curve indicates that the market continues to expect natural gas prices to rise, specifically from $2.99 per mmBtu to $5.28/mmBtu over five years.
The Avalon Advantage – Visit our website at www.avalonenergy.us, call us at 888-484-8096, or email us at jmcdonnell@avalonenergy.us
Copyright 2012 by Avalon Energy® Services LLC