“Energy Prices Always Go Up”
There is a common perception that energy prices have been, and continue to be, on a one way path upwards. Is this the case? No.

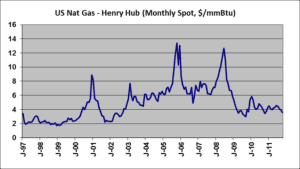
The graph above provides a historical view of natural gas prices. Plotted are the monthly average spot prices of natural gas at Henry Hub (a trading hub in Southern Louisiana) going back to 1997. During November 1997, natural gas prices averaged $3.08/mmBtu. One hundred and sixty-eight months later, during November 2011, prices averaged $3.28/mmBtu.
Between November 1997 and November 2011, the monthly average natural gas price has traded in the following range (values given are in $/mmBtu):
Maximum 13.42
Average 4.92
Minimum 1.72
While natural gas prices are volatile, they do not “always go up.” In fact, they have declined. The prices presented above are in nominal dollars. If they are adjusted for inflation, today’s prices are significantly lower in terms of real dollars.

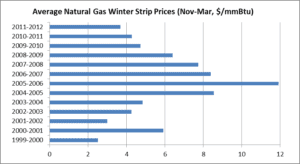
The natural gas “winter strip” represents the average futures price for natural gas over the five month period of November through March. As seen on the above graph, for this 2011/2012 winter, the winter strip closed below $4/mmBtu, which is a 10 year low. The two big drivers of declining natural gas prices are increased supply, in the form of new shale gas reserves, and decreased demand, resulting from the weak economy.
What does this mean for electricity? In the Mid-Atlantic, natural gas prices and electricity prices are highly correlated. Commercial businesses in many locations are now seeing electricity supply (generation and transmission) prices below 8 cents per kilowatt-hour.
The Avalon Advantage – Visit our website at www.avalonenergy.us, call us at 888-484-8096 or email us at jmcdonnell@avalonenergy.us
Copyright 2011 by Avalon Energy® Services LLC
